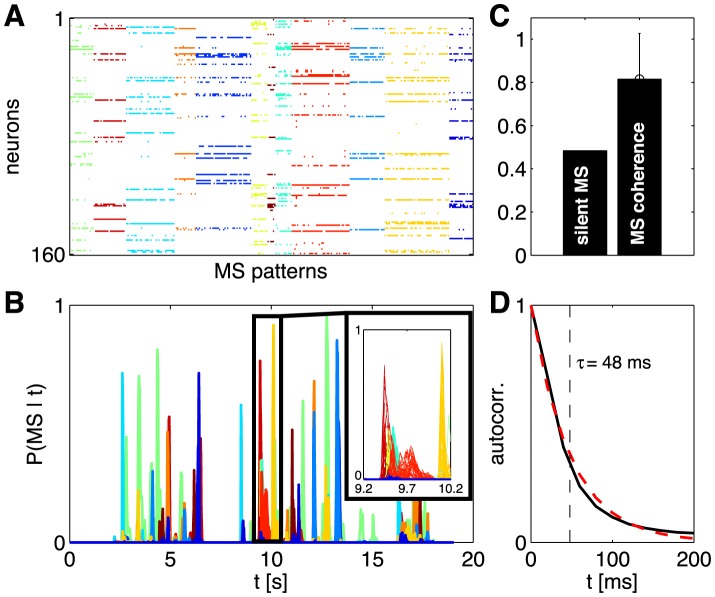
Figure 12. Basin assignments are reproducible across stimulus repeats and across subnetworks.
(A) Most frequently occurring MS patterns collected from 30 subnetworks of size N = 120 out of a total population of 160 neurons; patterns have been clustered into 12 clusters (colors). (B) The probability (across stimulus repeats) that the population is in a particular basin of attraction at any given time. Each line corresponds to one pattern from (A); patterns belonging to the same cluster are depicted in the same color. Inset shows the detailed structure of several transitions out of the all-silent state; overlapping lines of the same color show that the same transition is identified robustly across different subnetwork choices of 120 neurons out of 160. (C) On about half of the time bins, the population is in the all-silent basin; on the remaining time bins, the coherence (the probability of being in the dominant basin divided by the probability of being in every possible non-silent basin) is high. (D) The average autocorrelation function of traces in (B), showing the typical time the population stays within a basin (dashed red line is best exponential fit with τ = 48 ms, or about 2.5 time bins).

