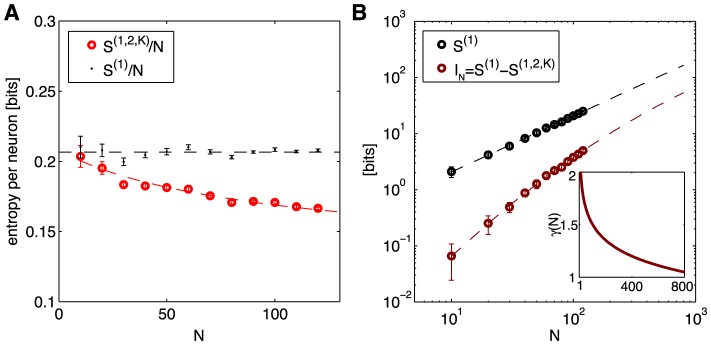
Figure 13. Entropy and multi-information from the K-pairwise model.

(A) Independent entropy per neuron,  , in black, and the entropy of the K-pairwise models per neuron,
  , in red, as a function of N. Dashed lines are fits from (B). (B) Independent entropy scales linearly with N (black dashed line). Multi-information
  of the K-pairwise models is shown in dark red. Dashed red line is a best quadratic fit for dependence of
  on
on  ; this can be rewritten as
  , where γ(N) (shown in inset) is the effective scaling of multi-information with system size N. In both panels, error bars are s.d. over 30 subnetworks at each size N.
