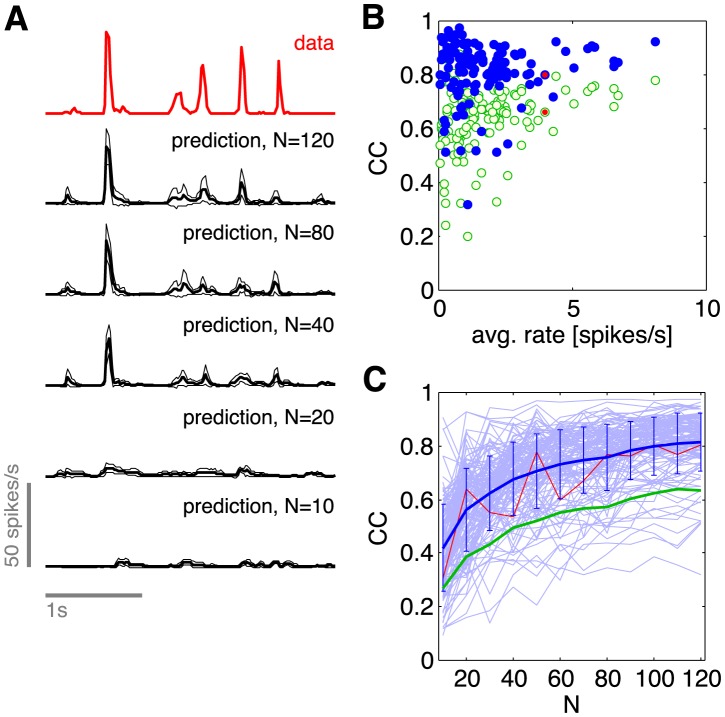
Figure 15. Predicting the firing probability of a neuron from the rest of the network.
(A) Probability per unit time (spike rate) of a single neuron. Top, in red, experimental data. Lower traces, in black, predictions based on states of other neurons in an N–cell group, as described in the text. Solid lines are the mean prediction across all trials, and thin lines are the envelope ± one standard deviation. (B) Cross–correlation (CC) between predicted and observed spike rates vs. time, for each neuron in the N = 120 group. Green empty circles are averages of CC computed from every trial, whereas blue solid circles are the CC computed from average predictions. (C) Dependence of CC on the population size N. Thin blue lines follow single neurons as predictions are based on increasing population sizes; red line is the cell illustrated in (A), and the line with error bars shows mean ± s.d. across all cells. Green line shows the equivalent mean behavior computed for the green empty circles in (B).

