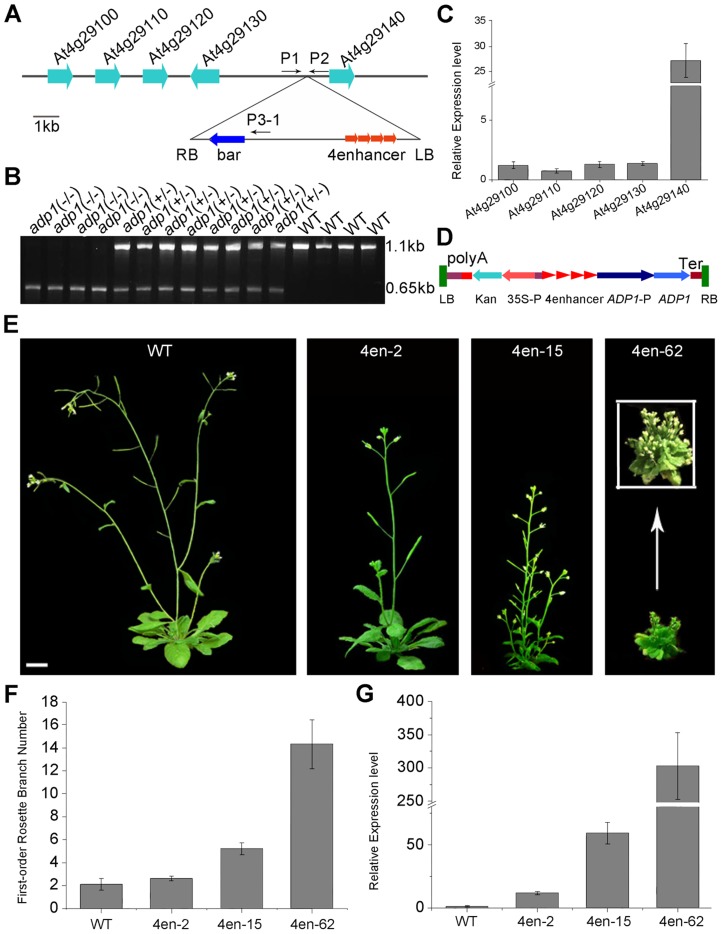
Figure 2. Characterization of the ADP1 gene.
(A) Schematic diagram of the genomic region flanking the T-DNA insertion site in adp1-D. The arrow direction represents the transcriptional orientation of the gene. The four red arrowheads represent the four 35S enhancers from pSKI015. LB, T-DNA left border; bar, Basta resistance gene; 4Enhancers, CaMV 35S enhancer tetrad; RB, T-DNA right border. (B) Linkage analysis of the T-DNA insertion and the bushy phenotypes. The primers P1 and P2 amplified an 1123-bp fragment from the wild type, and P1 and LBb1 amplified a 650-bp fragment from the homozygous adp1-D mutant. (C) Expression of genes flanking the insertion site in the wild type and the homozygous adp1-D mutant measured by quantitative RT-PCR with a Tubulin gene as an internal control. The expression levels of each gene in the wild type were set as 1.0. Error bars represent the SD of three biological replicates. (D) Schematic diagram of the construct for At4g29140 over-expression in plants driven by four 35S enhancers. LB, T-DNA left border; polyA, CaMV 35S poly(A); KanR, kanamycin resistance gene NPT II; 35S-P, CaMV 35S promoter; 4Enhancer, CaMV 35S enhancer tetrad; ADP1-P, promoter of ADP1; ADP1, open reading frame of ADP1; Ter, nopaline synthase terminator; RB, T-DNA right border. (E) Transgenic plants over-expressing At4g29140 driven by four 35S enhancers showed the accelerated growth rate and bushy phenotypes. Bar = 1 cm. (F) First-order rosette branch number in transgenic plants. (G) Quantitative analysis of the ADP1 expression level in transgenic plants. The expression level of the transgenic plants was in accordance with the severity of the phenotypes. Error bars represent three biological replicates.

