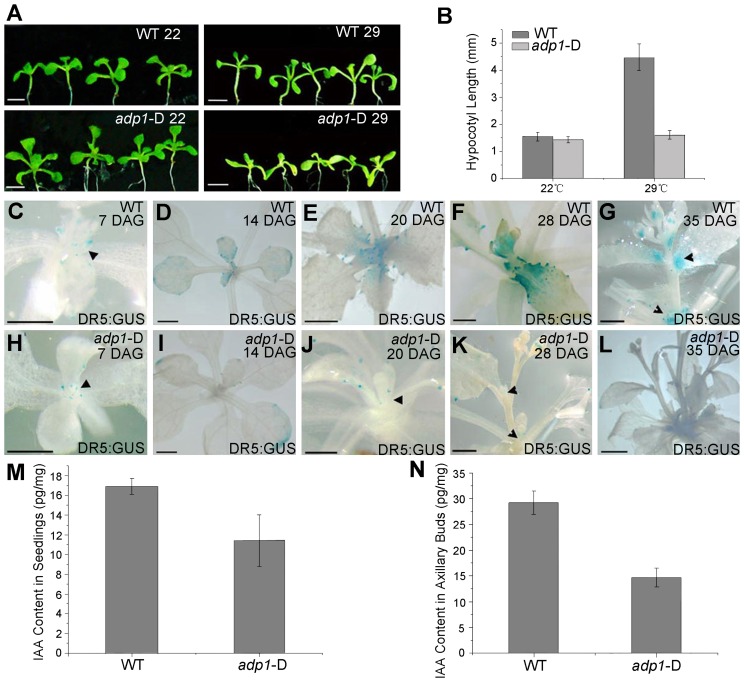
Figure 5. Evidence of reduced auxin levels in adp1-D mutants.
(A) Morphology of wild type (WT) and adp1-D seedlings after growth for 9 days at 22°C (left) and 29°C (right) under long-day conditions. The white vertical line indicates the average hypocotyl length of wild-type and adp1-D seedlings. Bar = 5 mm. (B) Hypocotyl length of wild-type and adp1-D seedlings grown at 22°C and 29°C. At least 30 seedlings of each genotype were measured. The error bars represent the SD. (C) to (L) Detection of DR5:GUS signal in wild-type (C–G) and adp1-D (H–L) plants at different developmental stages. DR5:GUS stained mainly in the shoot apical meristem, young leaves and axillary buds in the wild-type plants (indicated by black arrowheads), whereas the signal in corresponding tissues of adp1-D was reduced dramatically. Bar = 0.5 mm. (M) and (N) Free IAA content in young seedlings (M) and axillary buds (N). 200 mg of corresponding tissues were dissected for the measurements and each experiment had three biological replications.

