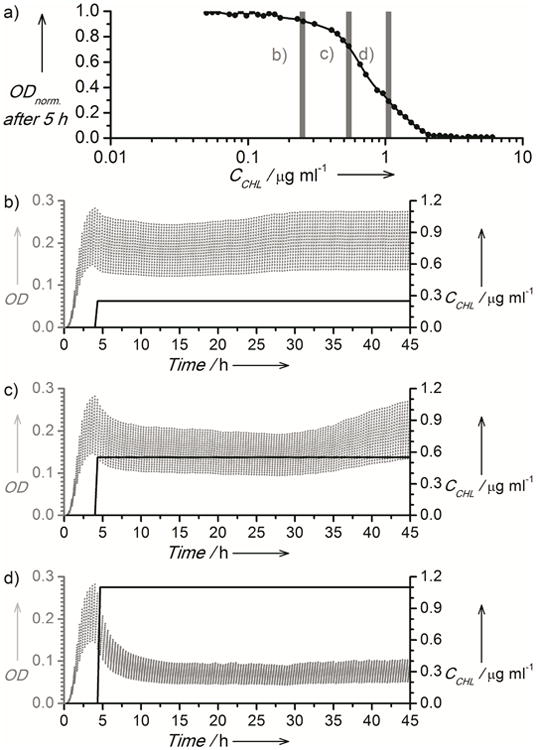
Fig. 4.

a) A plot of the relationship between the normalized optical absorbance of E. coli cells (λ =600 nm) and CCHL. Vertical bars indicate concentrations used in adaptation experiments b-d. The right axis of plots b-d depicts the concentration of antibiotic (black solid line), and left axes depict the optical density measured in the microchemostats (grey dots).
