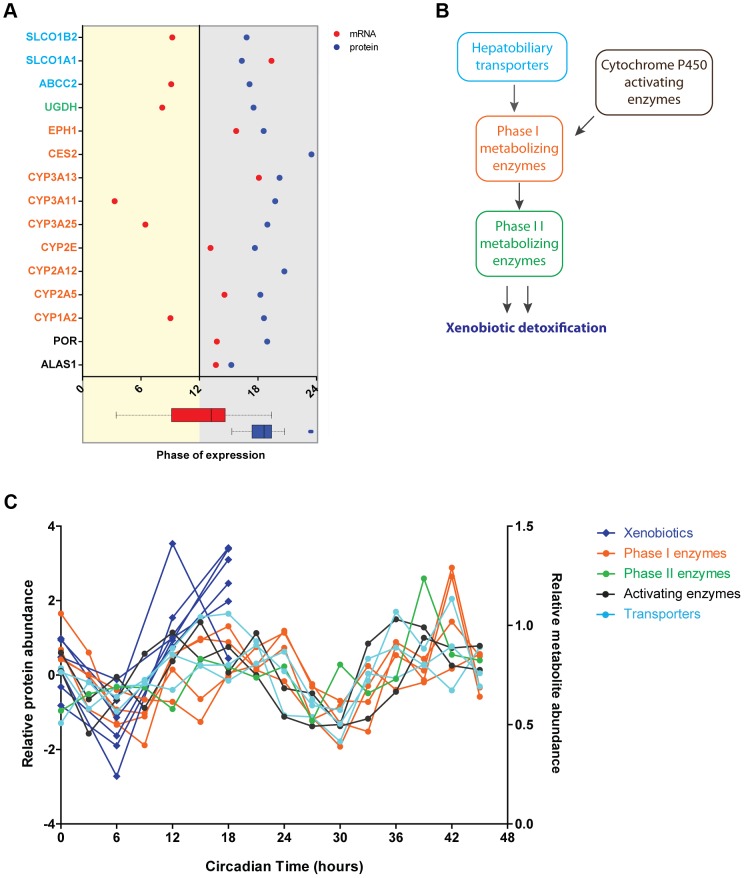
Figure 5. Circadian regulation of metabolism of xenobiotics is large shaped post-transcriptionally.
(A) Cycling proteins involved in metabolism of xenobiotics show concomitant phases of abundance in the middle of the night. Graph showed calculated phases of abundance for cycling proteins (blue) involved in the detoxification pathway and their corresponding mRNA (red). Lack of mRNA data in the graph indicates an arrhythmic transcript. At the bottom box plots representing graphically the data of the mRNA (red) and protein (blue) phases plotted in the graph. Protein names are color coded based on their functional role in the pathway as indicated in B. We found 97 proteins involved in this pathway in the total 3131 dataset and 15 proteins in the cycling dataset of 201. (B) Circadian oscillations are found in proteins essential for different stages of the metabolism of xenobiotics. Scheme showing the main two phases of xenobiotic detoxification as well as the contribution of enzymes activating cytochrome P450 proteins essential for phase I and liver transporters. (C) The abundance of rhythmic proteins from the detoxification pathway matches remarkably the levels of xenobiotics in the liver. Expression profiles of cycling proteins (median of Z-scored log 2 normalized ratios for each triplicate) color coded according to their functional role (as in B) and the abundance profile of several xenobiotics n the liver reported by Eckel-Mahan et al. [10].

