Figure 5.
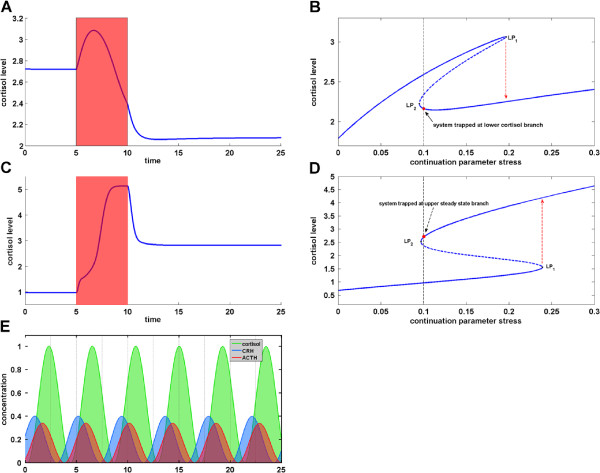
Dynamic Repertoire of the HPA network model. The figure displays different types of qualitative dynamic behavior featured by the HPA axis model from Figure 2 which is larger than for other HPA network models reported earlier in the literature. The corresponding model parameter settings have been found using inverse problems and bifurcation discovery tools. The bifurcation diagrams (B) and (D) show the steady state concentration of cortisol in dependence on the stress level. For a certain stress region the system exhibits two stable steady states (indicated by solid lines) and one unstable steady state (dashed line). A) Simulation of a dysfunctional stress response of cortisol in hypocortisolism. Though the stress is only temporary (red period), the system is driven to and eventually caught in an alternative stable steady state characterized by an insufficient cortisol level. B) Irreversible bistable switch explaining the behavior shown in (A). Once the system is driven from the upper steady state branch it is trapped at the lower branch due to a limit point LP2 abscissa smaller than the basal stress level 0.1. C) Simulation of a dysfunctional stress response of cortisol in hypercortisolism. Though the stress is only temporary (red period), the system is driven to and eventually caught in an alternative stable steady state characterized by an excessive cortisol level. D) Irreversible bistable switch explaining the behavior shown in (C). Note the inverted alignment of cortisol steady state branches and alternative location of limit points in comparison to (B). E) Simulation of limit cycle oscillations in the hormone concentrations of CRH, ACTH and cortisol (relative to the maximum cortisol level).

