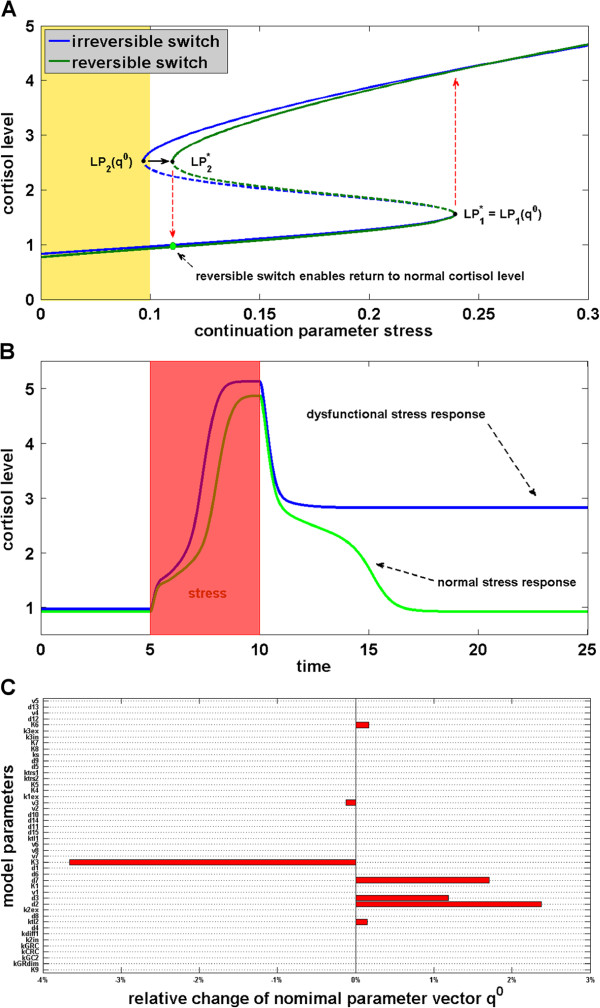
Figure 6.
Targeting the irreversible switch of the HPA axis model for hypercortisolism. A) The blue equilibrium curve corresponds to the irreversible switch of hypercortisolism depicted also in Figure 4B. A shift of the limit point LP2(q0) to the region right to the basal stress level turns the irreversible switch into a reversible one (green equilibrium curve). This design goal can be formulated and solved using inverse problems techniques. B) Comparison of the dysfunctional stress response with the normal stress response after network manipulation allowing the return to normal cortisol levels following a short stress period (red area). C) Display of the necessary model parameter corrections x (relative to the nominal values of q0) in order to achieve the transition from an irreversible to a reversible switch as shown in Figure 5A. Due to the use of a sparsity promiting penalty function only a few parameters need to be altered.

