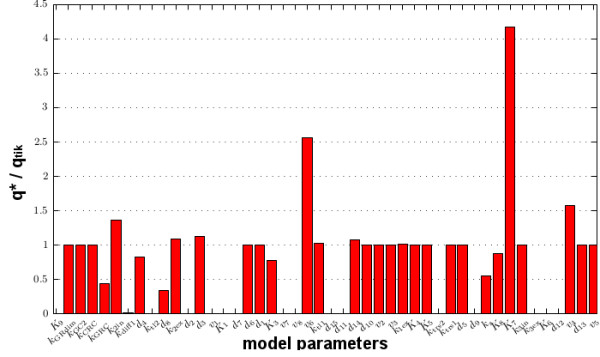
Figure 7.

Comparison of parameter solutions for data fitting. Plot of q∗/qtik (in componentwise sense) with the parameter vectors q∗ and qtik as inferred from the experimental data of Figure 4A in a two step approach. The result shows that certain pathways of the model are of minor relevance for the reproduction of the experimentally observed dynamics as given in Figure 4B.
