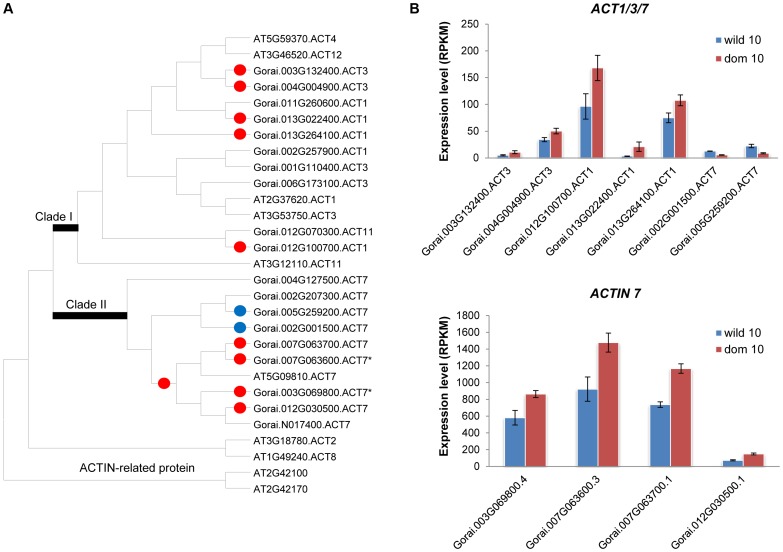
Figure 3. Phylogenetic relationship of ACTIN and their gene expression patterns at 10 dpa.
(A) Phylogenetic relationship of G. raimondii ACTIN genes. Red and blue dots on the node indicate up- or down regulation at domesticated cottons, respectively. Asterisk (*) shows ACTIN homologues previously studied. (B) Expression patterns of differentially expressed ACT genes. Bar denotes standard error.

