
Figure 2. Analysis of tertiles based on the conditional logistic models.
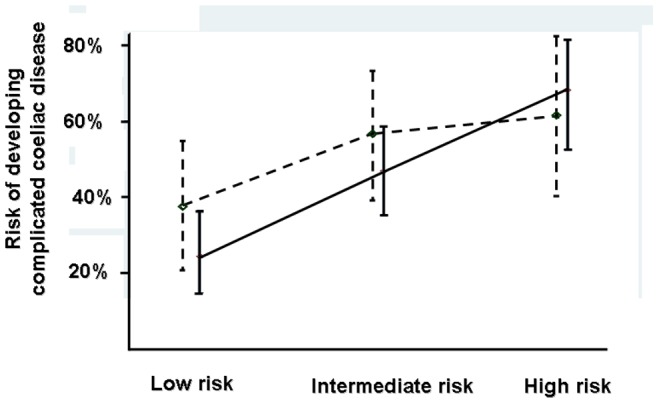
(mean, 95% confidence intervals). Black lines show analysis without HLA-DQ2 homozygosity (Chi square, p<0.001) while dotted lines show analysis including HLA-DQ2 homozygosity (Chi square, p = 0.005).