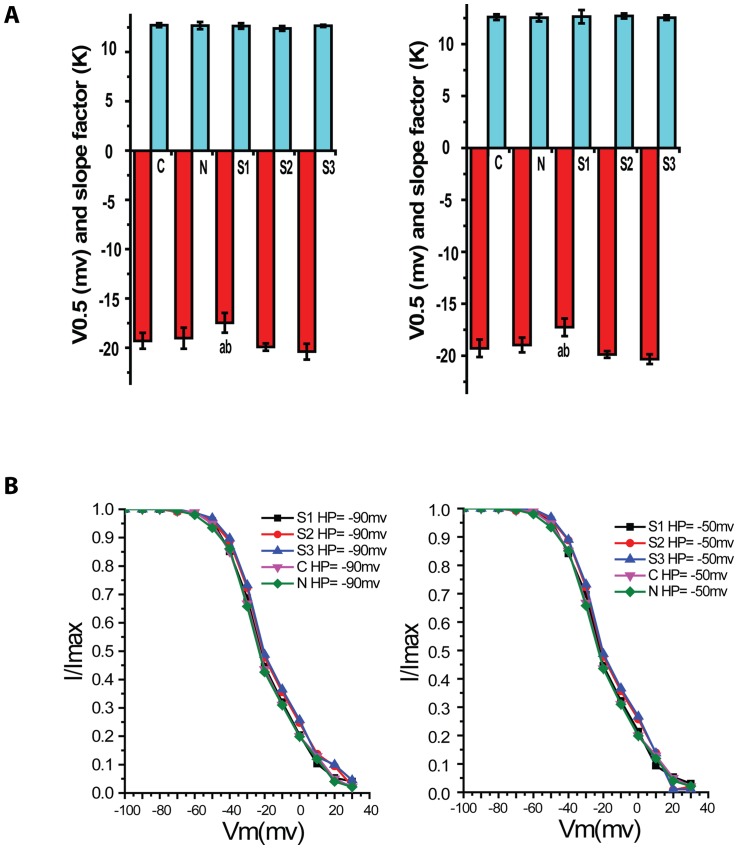
Figure 4. Voltage-dependent Ca+2 channel currents in rabbit basilar artery smooth muscle cells after SAH.
The graph A and B showed steady-state inactivation curves at HP of −90mV and −50mV respectively. The abscissa was voltage (mV) and the ordinate was relative conductivity (G). Compared with C group, steady-state inactivation curves of S1–S3 groups at HP of −90mV and −50mV shifted to the right, but it had only significant difference in S3 group (P<0.05, n = 8/group).

