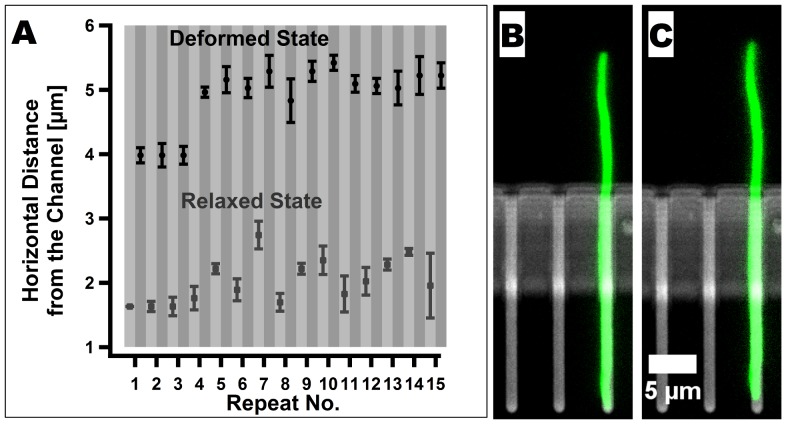
Figure 4. Reversibility of the deformation of non-growing cells.
(A) Horizontal distance from the tip of a cell to the growth channel for a repeated application of flow of 
 followed by a recovery phase. Altogether, a force was applied on the cell 15 times. After each time, the flow was reduced to
 and the fluid was allowed to flow into the second inlet as well as to the outlet. The small difference in the horizontal distance after three recoveries phases results from a small sliding of the cell during the application of the force. (B) - (C) A non-growing cell conformation before (B) and after (C)
  hours of experiencing flow at a rate of
 , followed by a recovery phase similar to the one that is described above.

