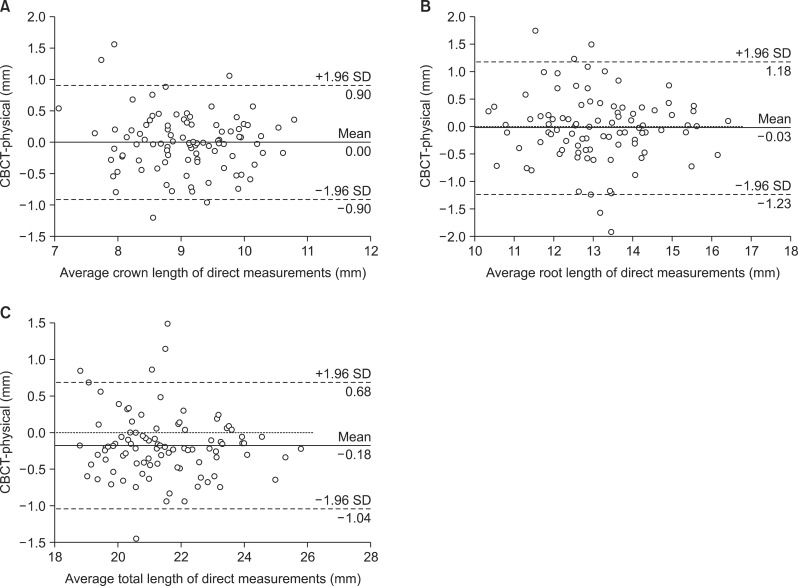
Figure 3.
Bland-Altman plots of the cone-beam computed tomography (CBCT)-based and direct length measurements of the extracted premolars. The CBCT-physical difference (dotted line), mean difference (thick solid line) and 95% limits of agreement (dashed line) are shown. A, Crown length. B, Root length. C, Total tooth length.
SD, Standard deviation; CBCT-physical indicates difference of CBCT-based and direct length measurements.

