
Figure 7. Nonlinear response functions.
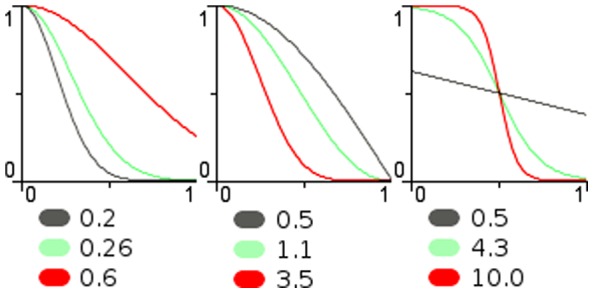
For each function, the input (normalised distance from the field centre) is along the abscissa and the output response is along the ordinate. Left shows a Gaussian function with coefficient  0.2, 0.26 and 0.6. Centre shows a cosine function with
  0.5, 1.1 and 3.5. Right shows a sigmoid function with
  0.5, 4.3 and 10.0. All values are normalised to 1.