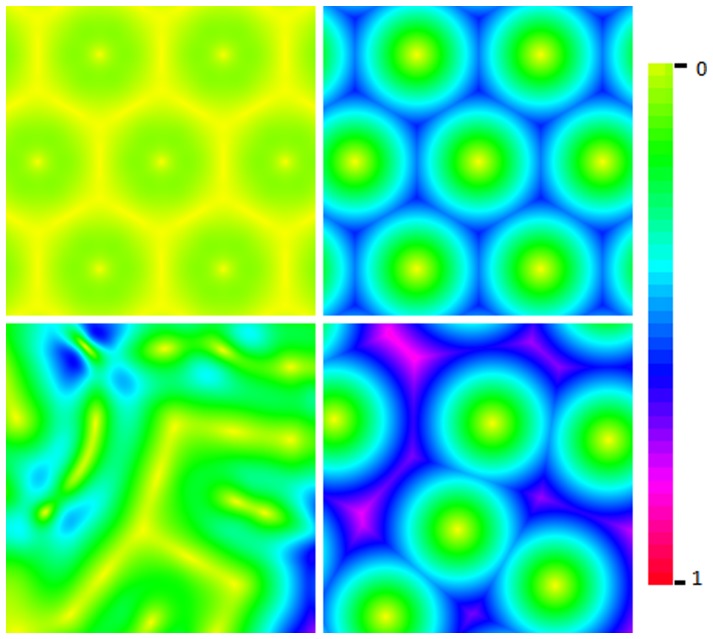
Figure 11. Benefits of overlap.
Error map depicting triangular (top row) and random (bottom row) topologies. The left column uses vector averaging and the right column is a single field response. Each pixel on the map is used as a stimulus point and the distance between the result and original point is denoted by the colour of the pixel. Errors range from 0 to 1 field radius.

