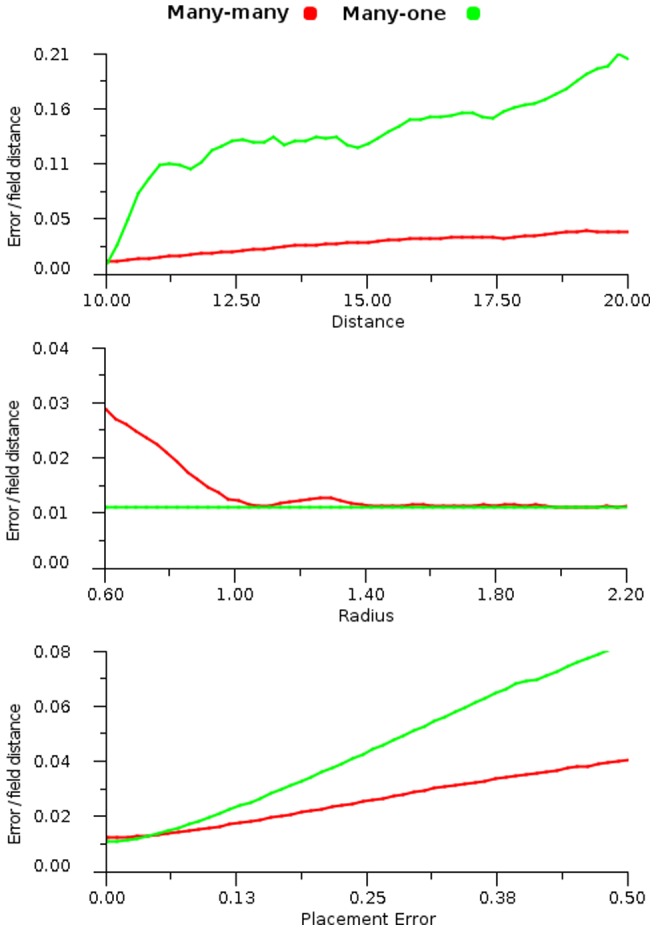
Figure 31. Transformation error comparisons.

Error plots of cross modal maps using a compression transformation function and varying: distance (top), radius (middle) and placement error (bottom). The results compare the behaviours of the many-to-one and the weighted link many-to-many method. In each graph the transmitting map  is fixed at
  , distance spacing
  and zero placement error, whilst the receiving map is adjusted as described in the abscissa.
