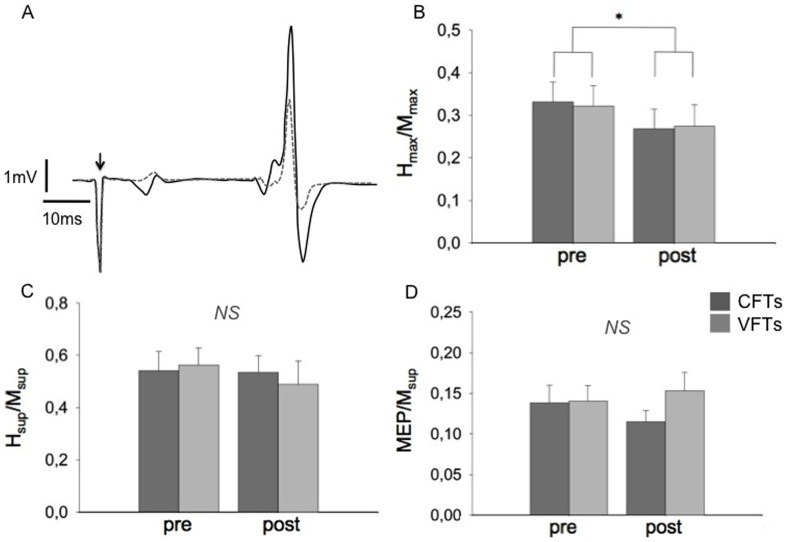
Figure 4. Electrophysiological responses at pre- and post-fatigue conditions.
A. Typical recording of the Hmax response of a representative subject. Hmax was elicited at rest and was accompanied by a submaximal M-wave. The arrow indicates time of stimulation. The solid black line corresponds to pre-fatigue and the dashed grey line represents post-fatigue measurement. B, C and D show ratios (mean ± SEM) of Hmax/Mmax, Hsup/Msup and MEP/Msup respectively, obtained before and after the stimulation protocols. Dark grey bars represent the CFTs protocol while grey bars the VFTs protocol. * P<0.05 significant pre-post effect, NS not statistically significant.

