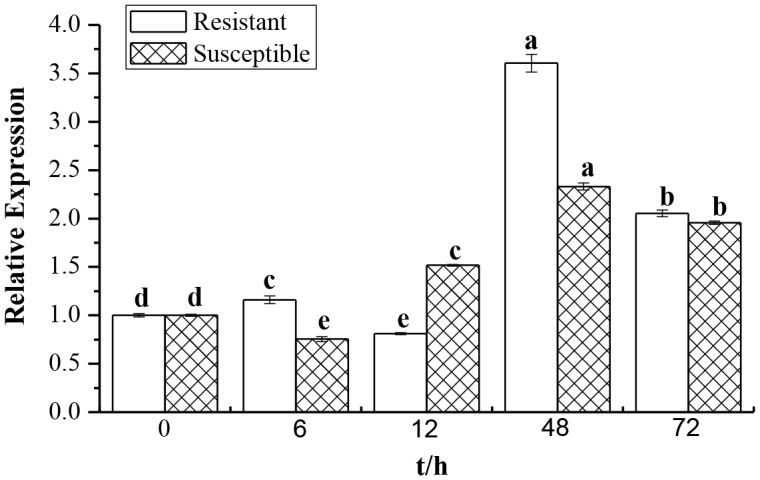
Figure 6. Q-PCR analysis of the ScCAT1 expression patterns in biosystem of sugarcane-smut (Sporisorium scitamineum) interaction.

Data was normalized to the GAPDH expression level. All data points (deduction its mock) are means±SE (n = 3). Resistant: Yacheng05–179 variety; Susceptible: Liucheng03–182 variety.
