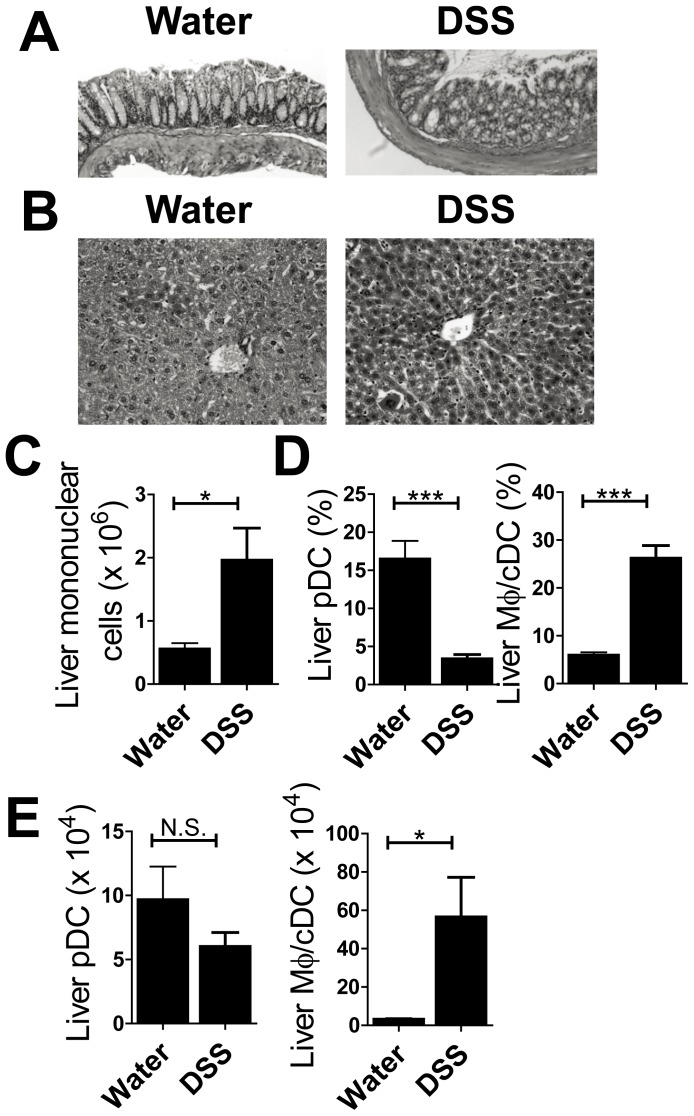
Figure 6. Hepatic infiltration of Macrophages are obserbed in DSS-treated RAG-2−/− mice.
(A) H&E specimens of colon from mice treated with water (left) or 4% DSS (right). Magnification, ×100 (B) H&E specimens of liver from water- (left) and DSS-treated (right) mice. Magnification, ×200 (C) The number of liver mononuclear cells for each group of mice. (D) Proportion and (E) absolute number of PDCA-1+CD11b−CD11cint pDCs and CD11b+CD11c− macrophages among whole mononuclear cells. Data are representative of two independent experiments. Values are presented as the mean ± SEM for each group (n = 4, water-treated group; n = 4, DSS-treated group). *P<0.05. N.S., no significant difference.

