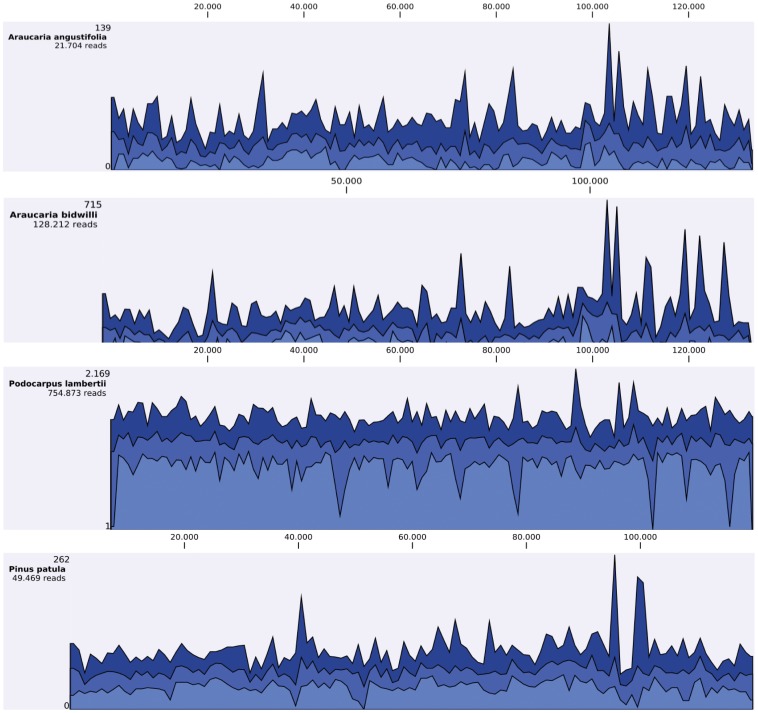
Figure 4. Reference graph track showing observed coverage values.
Different colors show the minimum (light blue), mean (blue), and maximum (dark blue) observed coverage values for all genomic regions (data aggregation above 100 bp). Araucaria angustifolia, Araucaria bidwilli, and Podocarpus lambertii sequence reads were mapped on Podocarpus totara; Pinus patula sequence reads were mapped on Pinus thunbergii.

