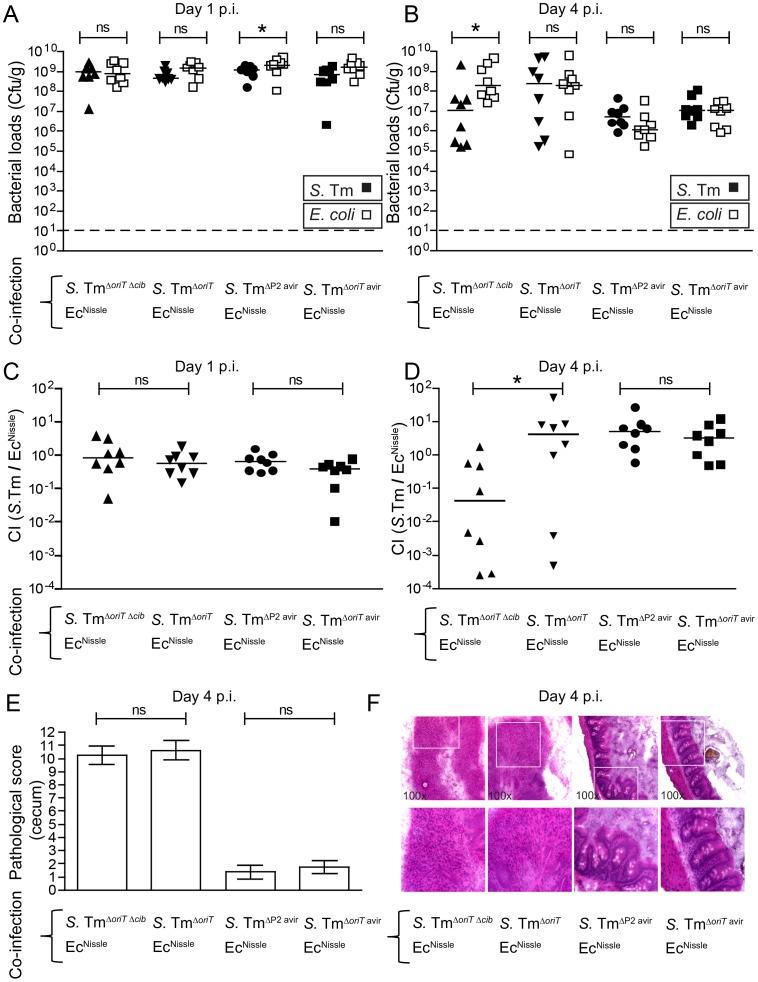
Figure 2. Colicin-dependent competition of S. Tm and E. coli in the gut in inflammation-induced “blooms” in conventional mice.
Streptomycin-treated conventional mice were co-infected with 1∶1 mixtures of S. TmΔoriT Δcib and EcNissle, S. TmΔoriT and EcNissle, S. TmΔP2 avir and EcNissle or S. TmΔoriT avir and EcNissle. S. Tm (black) and E. coli (white) colonization densities (Cfu/g) were determined at day 1 (A) and day 4 p.i. (B) in the feces and cecum content respectively. (C, D) Competitive indices (CI; ratio of S. Tm/E. coli) were determined for individual mice shown in (A) and (B). Bars show the median. (E) Histopathological analysis of cecal tissue of the infected mice. Cecal tissue sections of the mice were stained with hematoxylin/eosin (H&E) and the degree of submucosal edema, neutrophil infiltration, epithelial damage and loss of goblet cells was scored (Materials and Methods). 1–3: no pathological changes; 4–7: moderate inflammation; above 8: severe inflammation. Bars show mean and StD. (F) Representative H&E–stained cecal sections of mice shown in (A–E). Magnification 100-fold. Enlarged sections (squares) are shown in the lower panels. Dotted line: detection limit (1 cfu/g).

