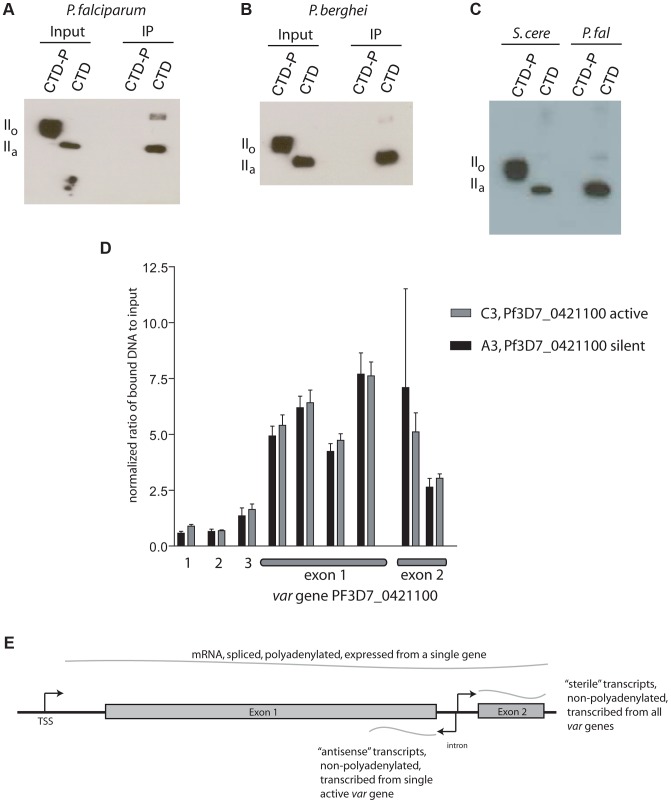
Figure 3. Phosphorylation dependence of PfSET2 binding to the CTD and enrichment of H3K36me3 at var loci.
(A) Co-immunoprecipitation assays showing that phosphorylation of the CTD of Rpb1 eliminates binding by PfSET2. The two left lanes show the flag-tagged P. falciparum Rpb1 in its phosphorylated (IIo) or unphosphorylated (IIa) states. The right two lanes show blots of co-immunoprecipitation assays after incubation of bacterial lysates containing the HA tagged, N-terminal region of PfSET2 (PfSET21–359) with phosphorylated and unphosphorylated CTD. Phosphorylation of the CTD disrupts binding by PfSET2. (B) Co-immunoprecipitation assays as in A performed with the CTD of Rpb1 from P. berghei. (C) Direct comparison of the CTD binding affinities of SET2 from S. cerevisiae and P. falciparum. The SRI from S. cerevisiae (left two lanes) interacts preferentially with the phosphorylated form of the P. falciparum CTD (left) but also displays lesser binding to the unphosphorylated form (right). The right two lanes show the same assay with the P. falciparum SRIR region (amino acids 1–359). The SRIR displays specific binding to the unphosphorylated CTD (right) and little or no binding to the phosphorylated form (left).(D) Chromatin immunoprecipitation assays from ring stage parasites using anti-H3K36me3 antibodies. The assays show enrichment of the H3K36me3 mark in both exons of var gene PF3D7_0421100. Lanes 1 and 2 represent control genes encoding seryl t-RNA synthetase and actin, respectively. Lane 3 represents the gene for circumsporozoite protein. The remaining lanes represent regions within the coding portion of both exons of the var gene PF3D7_0421100. Black bars show results from chromatin extracted from the C3 line of NF54, in which PF3D7_0421100 is the actively expressed var gene. The gray bars show chromatin extracted from the A3 line of NF54 in which this var gene is transcriptionally silent. The bars display the mean +/− standard deviation of relative amounts of bound DNA (see methods) from four independent experiments. Similar experiments using no-specific antibodies or control antibodies against core histone H3 showed no specific enrichment at PF3D7_0421100 (not shown). The graph shown represents the signal for each gene normalized to the control gene ctrp. The data is shown as % input without normalization in Figure S7. (E) Schematic representation of a typical var gene. Note that each gene has three promoters, one upstream of the coding region and responsible for transcribing an mRNA from the single, active var gene and two within the intron transcribing ncRNAs in opposite directions. The intron promoter that transcribes the antisense ncRNA is active during rings stages and is only active in genes that are also transcribing mRNA. The intron promoter transcribing ncRNA in the sense direction leads to expression of “sterile”, ncRNAs during late trophozoites and schizonts and is active in most or all members of the var gene family.

