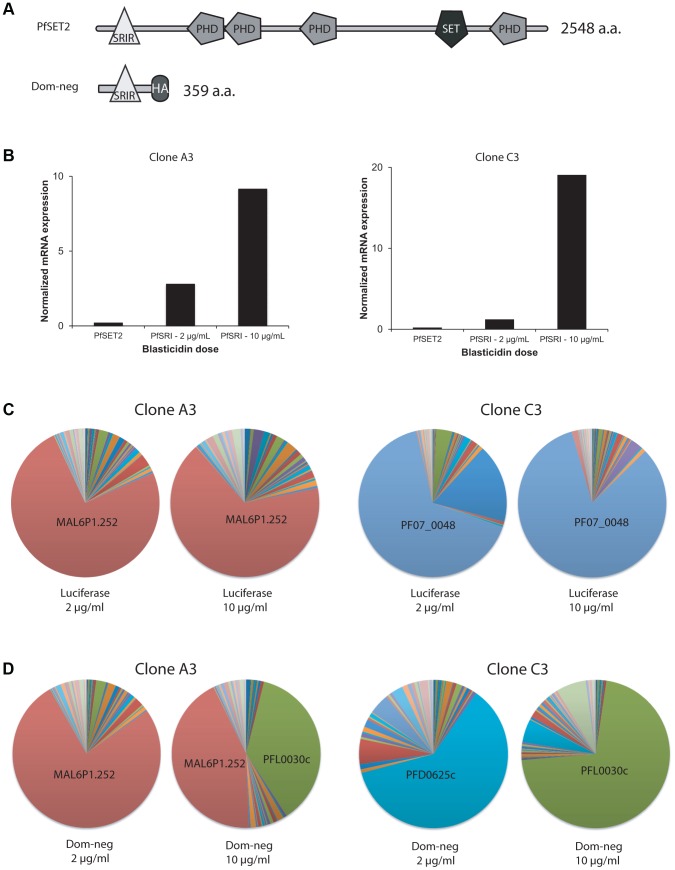
Figure 4. Over-expression of a dominant-negative version of PfSET2 in cultured parasites.
(A) Schematic diagrams showing the domain structures of the endogenous PfSET2 protein (top) and the truncated, dominant-negative version that contains only the N-terminal 359 amino acids (bottom), including the CTD-binding domain (SRIR). (B) Histograms showing RNA expression levels of the endogenous PfSET2 gene (PfSET2) and the dominant-negative construct (PfSRIR) under 2 and 10 µg/ml blasticidin. Two separate subclones of NF54 were transfected, A3 (left) and C3 (right). (C and D) Pie charts representing var gene expression patterns for A3 (left) and C3 (right) when over-expressing either firefly luciferase (C) or the PfSET2 dominant-negative construct (D). The different wedges of the pie indicate the proportion of the total var mRNA pool represented by transcripts for each individual gene (as described in [28]).

