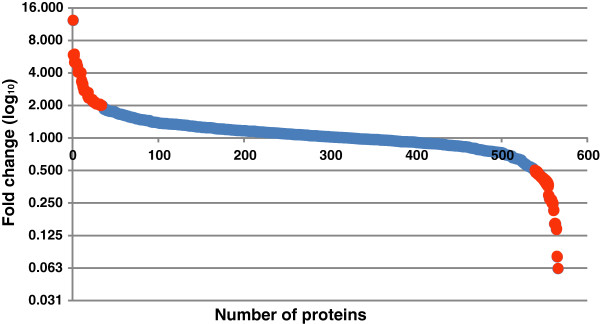
Figure 1.

Protein distribution. Proteins identified are plotted against the logarithmic values of their fold change in chikungunya serum samples when compared to that of controls. Red colored dots represent the differentially expressed proteins (≥ 2-fold).
