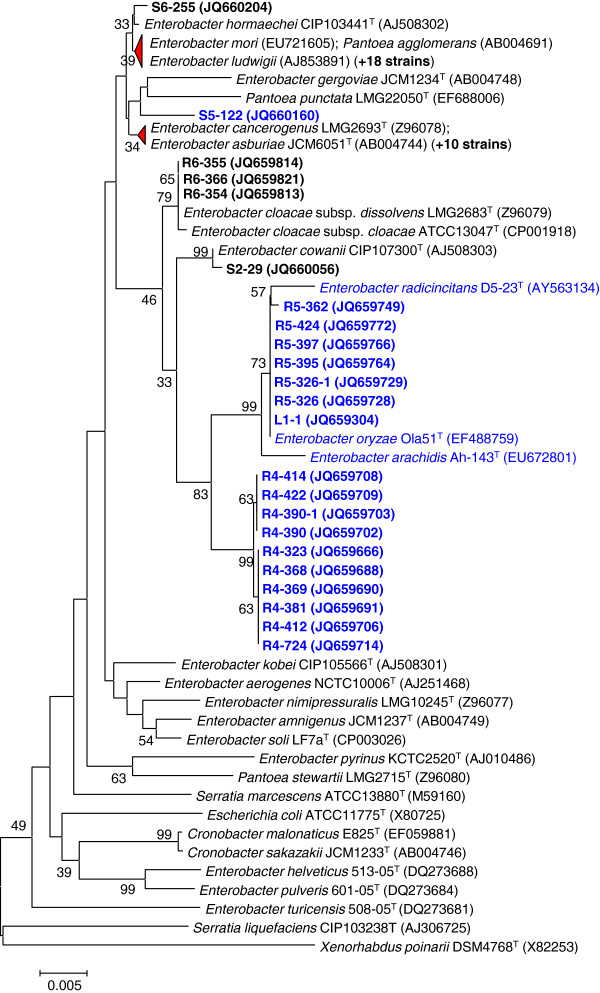
Figure 1.
Taxonomical classification of isolated Enterobacter strains. Phylogenetic tree was based on 16S rRNA gene sequences, of which the Genebank accession numbers are shown in the brackets. Bootstrap values (expressed as percentages of 1000 replications) greater than 30% are shown at the branch points. Bar: 0.005 substitutions per nucleotide position. Potential nitrogen-fixing strains, which were positive for the nifH gene as judged by PCR amplifications and sequence confirmation, are shown in indicated in blue. The number of isolates highly related to E. ludwigii and E. asburiae are indicated by the number in the bracket, respectively.

