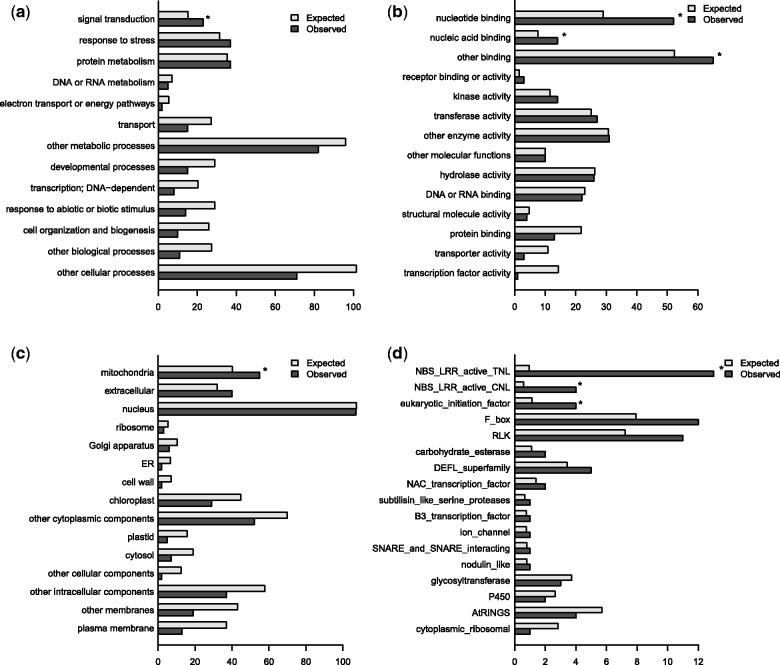
Fig. 1.
Distribution of E-PAV genes (n = 330)—those with at least one, but not all, exons missing in at least one accession—by GOslim categories for molecular function (a), biological process (b) and cellular component (c), and by family (d). Both expected and observed number of E-PAV genes per category represented on each bar. Where there is a significant enrichment (P ≤ 0.05) between the amount of observed and expected E-PAV genes for a particular category, an asterisk is shown over the bars. Only categories with at least one E-PAV gene are shown.

