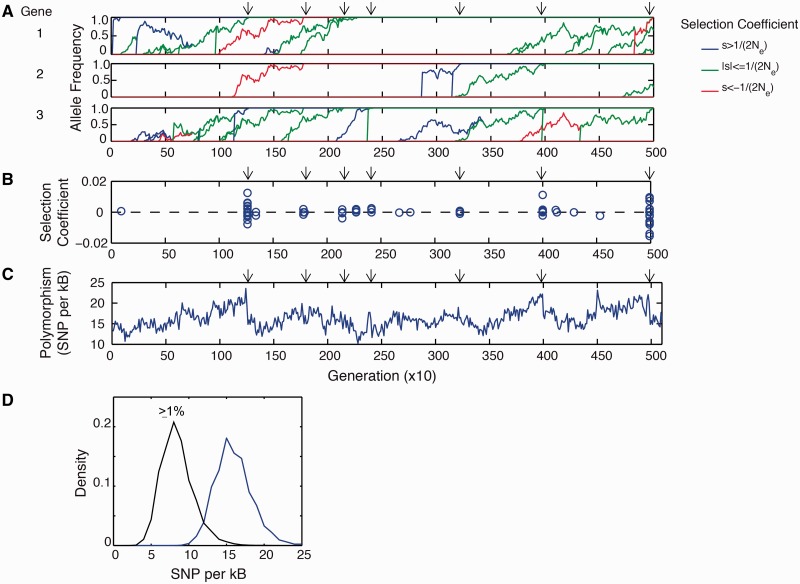
Fig. 2.
Mutation–selection balance under pervasive clonal interference. (A) Sample history of mutations that reached fixation. Time interval corresponds to figure 1C. Arrows indicate the correlated fixation of mutations. (Only three genes are shown; see supplementary fig. S3, Supplementary Material online, for the complete trajectory.) (B) Selection coefficients of mutations that successfully fixed. (C) Extent of polymorphism in the evolving population. Drop in diversity accompany clonal sweeps. (D) Distribution of SNPs in the simulation. All SNPs (blue); SNPs with allele frequencies ≥1% (black).

