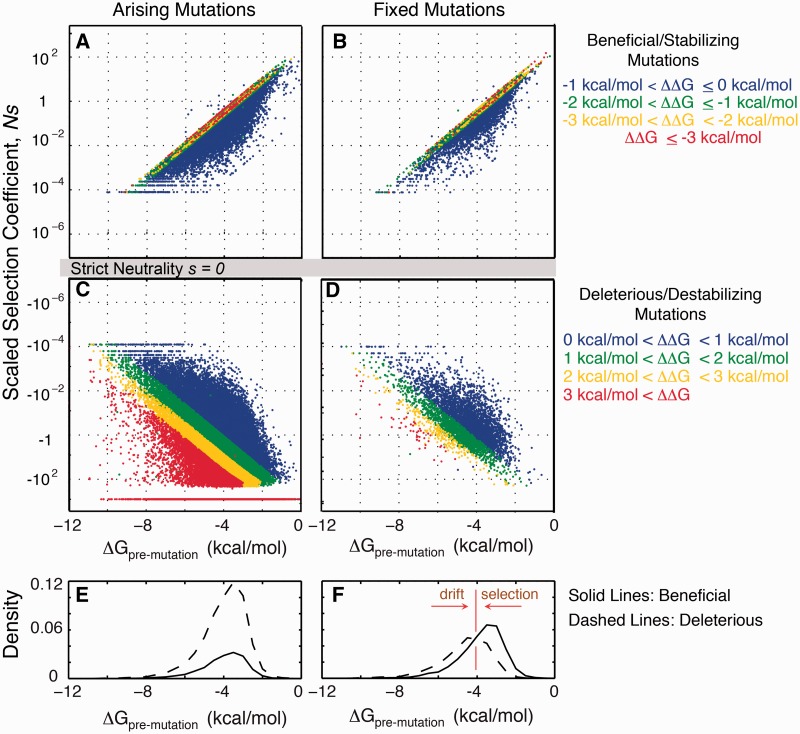
Fig. 4.
Influence of epistasis in the mapping between the molecular effect of a mutation ΔΔG to its phenotypic effect s. X axis is the premutation ΔG. Mutations are colored according to the magnitude of the ΔΔG (see leftmost panel for color assignment). (A) Arising random beneficial (stabilizing) mutations. (B) Fixed beneficial mutations. (C) Arising random deleterious (destabilizing) mutations. (D) Fixed deleterious mutations. In panels (A)–(D), premutation ΔG modulates the magnitude of s for a given ΔΔG such that mutations are more neutral when it occurs in more stable proteins. (E) Solid line is the distribution of arising beneficial mutations (panel A) while dashed line is the distribution of arising deleterious mutations (panel C). Each histogram is normalized to the total number of mutations. (F) Similar to panel E but for fixed mutations. In the stable regime, drift dominates, whereas in the unstable regime, selection dominates. For the sake of clarity, we plot only 1/102 or 1/(10Ne) of the total number of arising mutations sampled randomly.

