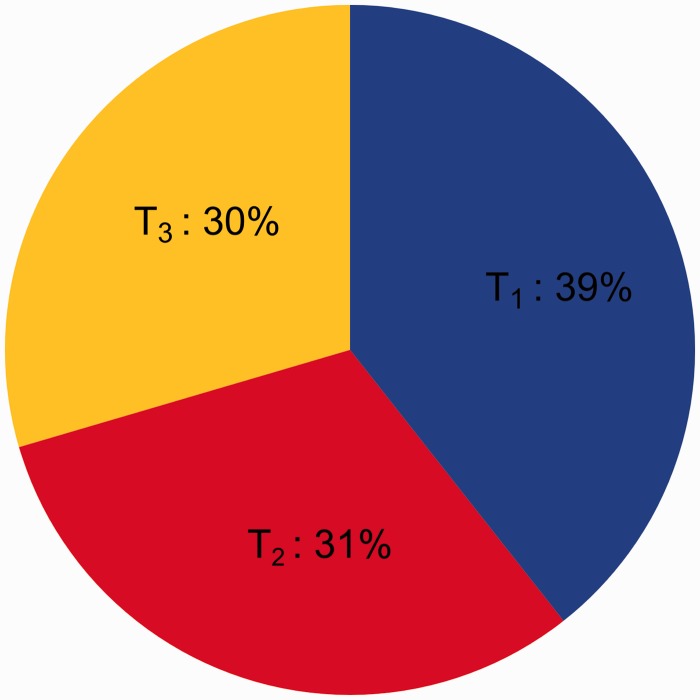
Fig. 2.
Results of the FcLM for all OGs in data set M_Ento. The chart shows the proportion of quartets (summed up for 117 OGs) that show predominant support for T1 ([Protura + Diplura] – [Collembola + remaining taxa], Nonoculata hypothesis, blue), T2 ([Protura + Collembola] – [Diplura + remaining taxa], Ellipura hypothesis, red), and T3 ([Diplura + Collembola] – [Protura + remaining taxa], yellow), see fig. 5. Quartets mapping in remaining Voronoi cells (gray) and T* (fig. 5) were not considered.

