FIGURE 3.

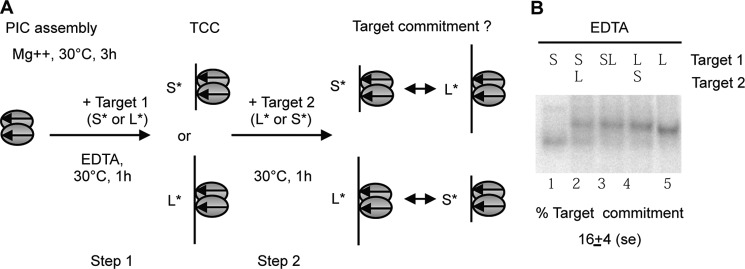
Target commitment. A, diagram of the two-step assay used to measure target commitment. Two labeled targets different in size (short (S*) or long (L*)) were used. PIC was first assembled with unlabeled PC-ITR. During this first step, TCC was allowed to proceed with the labeled target 1 (short (S*) or long (L*)). At step 2 of the assay, a second target of distinguishable size was added. After a further incubation for 1 h at 30 °C, the complexes obtained were analyzed by EMSA. To find out whether either of the two targets is preferred for TCC formation, a mix of both targets was incubated during a 2-h assay. The same molar concentration of targets was used in each assay. B, TCC formation was performed with short (S), long (L), or a mix of short and long targets (SL) in the same molar concentrations as controls. Target commitment was assayed as described in A (lanes 2–4). Experiments were repeated six times and quantified. The amount of complex formed with the first target is divided by the amount of the complex formed with the same target when both targets are added together. The averages of target commitment are indicated below the panel. The significance of the differences (lane 2 versus lane 3 and lane 4 versus lane 3) was assayed using a Kruskal-Wallis test and resulted in a p value of 0.7.
