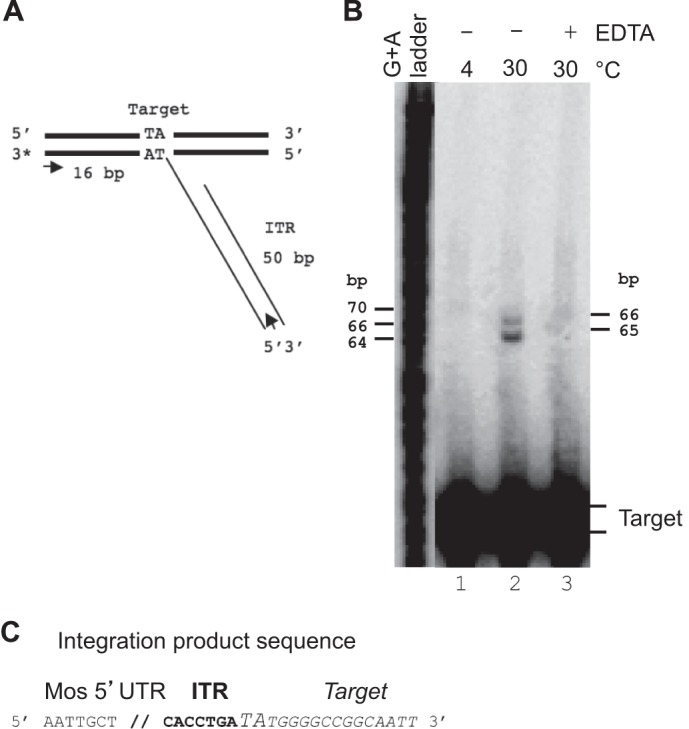
FIGURE 4.

Integration assays. A, diagram showing the expected integration of the PC-ITR into the labeled target. The positions of the PCR primers used to amplify the integration products are indicated by arrows. B, TCCs were allowed to proceed as described for Fig. 1A, under various conditions: 4 °C with Mg2+ (lane 1), 30 °C with Mg2+ (lane 2), and 30 °C with EDTA (lane 3). Integration products were recovered and loaded onto a denaturing gel. A G+A ladder was used to calculate the sizes of the integration products, which are indicated on the right. C, three products were sequenced after PCR amplification. They all contained the ITR (bold type) integrated in the target DNA (italic type) at the TA dinucleotide (oversized uppercase type), as expected.
