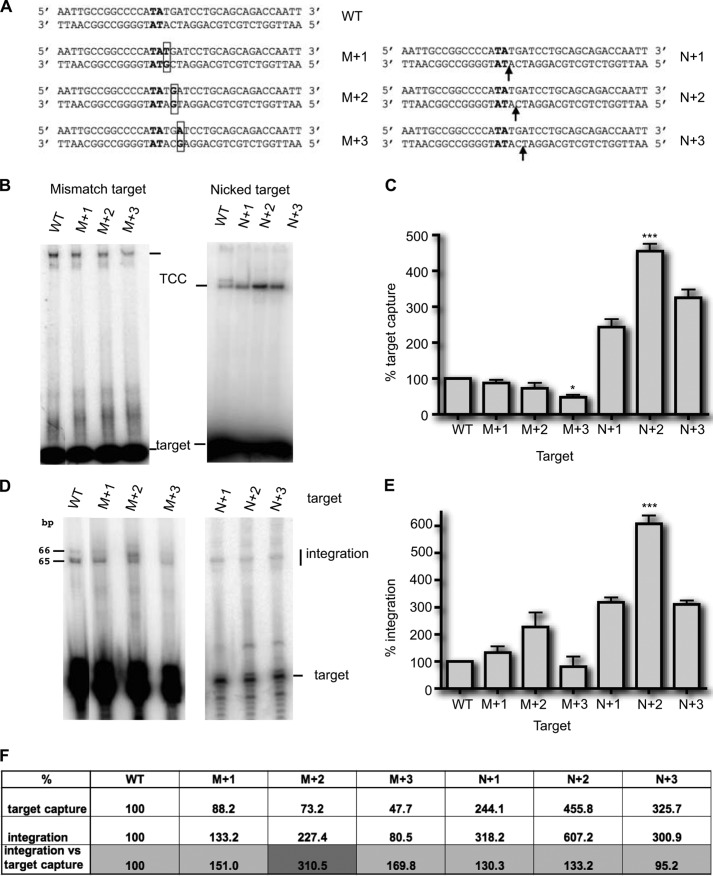
FIGURE 7.
Target capture assays using modified targets. A, the sequence of the wild type TA target (bold type) and targets with one mismatch (M+1, M+2, and M+3) or one nick (N+1, N+2, and N+3) are given. The mismatches are boxed, and arrows indicate the nicks. B, TCCs were assayed under standard conditions (Fig. 1A), using either mismatched targets (left panel) or nicked targets (right panel). The wild type TA target (WT) is used as a reference. The resulting complexes were analyzed in EMSA. C, experiments were repeated at least three times. For each target, the relative percentage of TCC was calculated and plotted as histogram bars. The significance of the differences between the different modified targets and the TA target was assayed using a Kruskal-Wallis test. Significant p values are indicated. ***, p < 0.001; *, p < 0.05. D, integration assays were performed as in Fig. 4, using either mismatched targets (left panel) or nicked targets (right panel). The results for the nicked targets were obtained using targets labeled on both strands and compared with a similarly labeled WT target. E, experiments were repeated at least three times, quantified, and plotted as histogram bars. The significance of the differences between each of the modified targets and the WT target was assayed using a Kruskal-Wallis test. Significant p values are indicated. ***, p < 0.001. F, the percentages of TCC and integration obtained in C and E, respectively, were reported for each target. To assess the strand transfer efficiency, regardless of the target capture efficiency, the integration was normalized according to the percentage of TCC formed with each target (integration percentages divided by TCC percentages).

