FIGURE 3.
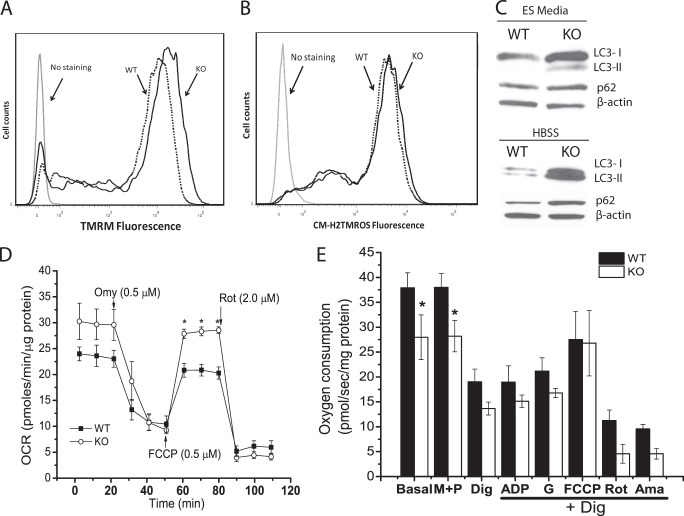
Mitochondrial membrane potential, ROS production, autophagy induction and oxygen consumption in WT and Cited2Δ/− ESCs. A, the mitochondrial membrane potential was measured by TMRM staining through flow cytometry and representative data are presented. Dashed line, WT ESCs; solid line, Cited2Δ/− ESCs. B, the levels of the reduced forms of mitochondrial ROS were determined by MitoTracker Orange CM-H2TMRos staining and representative data are presented. Dashed line, WT ESCs; solid line, Cited2Δ/− ESCs. C, conversion of LC3-I into LC3-II and p62 protein expression in WT and Cited2Δ/− ESCs. Cells were grown in complete ESC media and upon nutrient deprivation (in Hanks' balanced salt solution for 6 h) proteins were isolated and analyzed by Western blot assay. D, respiration of intact ESC mitochondria was determined using a Seahorse XF-24-based platform. WT and Cited2Δ/− ESCs (1.2 × 10⁵/well) were attached to a XF-24 plate in non-buffered assay media (containing 25 mm glucose, 2 mm l-alanyl-glutamine, and 2.5 mm sodium pyruvate). The OCR at basal, and upon sequential injection of oligomycin, FCCP, or rotenone was recorded and normalized by total protein mass. The experiment was repeated 4 times independently and one set of representative data are presented. E, the respiration of mitochondria was monitored in permeabilized ESCs by Oxygraph-2K-based workshop. ESCs were re-suspended in MiR05 buffer at a density of 1 × 10⁶/ml. Prior to permeabilization, oxygen consumption at the basal level, and after stimulating with malate (M, 2 mm) and pyruvate (P, 2.5 mm), cells were then permeabilized with digitonin (Dig, 2.5 μg/ml) and oxygen consumption was recorded. After permeabilization, the substrates indicated in the figure were added sequentially to determine the level of oxygen consumption. ADP, 2.5 mm. G, glutamate (10 mm). FCCP, 0.75 μm. Rot, rotenone (0.125 μm). Ama, antimycin (0.2 μm). The data are normalized by total protein mass and presented as mean ± S.E. of 3 independent experiments. *, p < 0.05 compared with WT controls.

