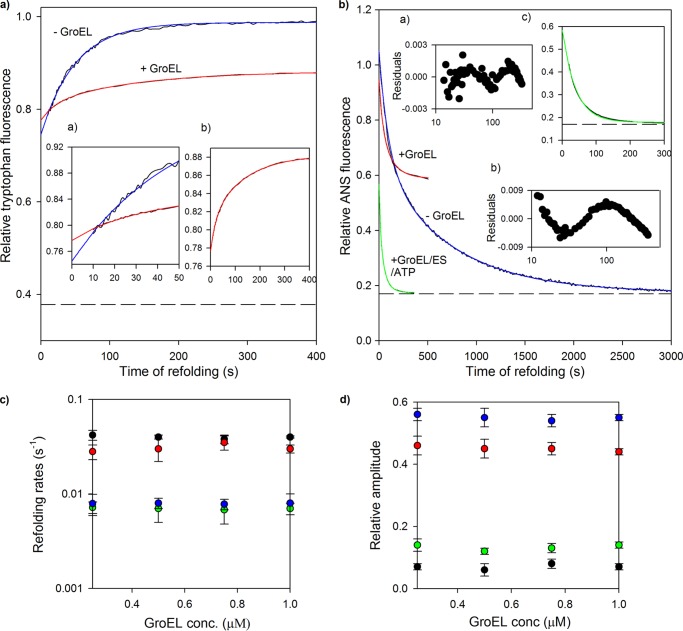
FIGURE 4.
Folding kinetics of MSG in presence of GroEL. Refolding of MSG was monitored in the presence and absence of GroEL by intrinsic tryptophan and ANS fluorescence. MSG (0.25 μm) was refolded in the presence of 0 and 1 μm GroEL in the refolding buffer containing residual GdnHCl (0.1 m). a, refolding kinetic traces monitored by tryptophan fluorescence at 340 nm when protein was excited at 295 nm. Blue and red continuous lines represent single and double exponential fits of kinetic refolding traces of MSG in the absence and presence of GroEL, respectively. Inset a shows the first 50 s of refolding, and inset b shows the refolding kinetic trace of GroEL-bound MSG. The broken line represents fluorescence of unfolded MSG in 3 m GdnHCl. The fluorescence of the relevant concentration of GroEL was subtracted from the GroEL-containing trace, and all fluorescence values were then normalized to a value of 1 for the fluorescence of MSG at 400 s of refolding in the absence of GroEL after which no further change in tryptophan fluorescence of MSG takes place. b, ANS fluorescence-monitored refolding kinetics of MSG at 450 nm. Blue and red continuous lines represent double exponential fits of kinetic refolding traces of MSG in the absence and presence of GroEL, respectively. The blue curve was derived by diluting denatured MSG in buffer containing ANS, whereas for the red curve, ANS fluorescence was monitored with time after diluting denatured MSG in buffer containing both GroEL and ANS. The green curve depicts a double exponential fit of the reactivation of GroEL-bound MSG. Insets a and b show the residuals of the double and single exponential fits of the green curve. Reactivation kinetics of GroEL-bound MSG was followed by addition of GroES and ATP in GroEL- and ANS-containing buffer. Inset c shows the first 300 s of the reactivation kinetics of GroEL-bound MSG. The t = 0 value of the green trace represents the ANS fluorescence value of GroEL-bound MSG, which is the same as the final steady state value obtained from the red trace. The final ANS concentration was 50 μm. Fluorescence values were corrected for background fluorescence caused by ANS in reactions lacking MSG and normalized to a value of 1 for ANS fluorescence of MSG at t = 0 of refolding in the absence of GroEL. The dashed line represents ANS fluorescence of native MSG. Refolding was performed by manual mixing with a dead time of 10 s. Data for refolding of MSG in the absence of GroEL were reproduced from previous work (40) for comparison. c, tryptophan fluorescence-monitored refolding rate constants of fast phase (black circles) and slow phase (green circles) and ANS fluorescence-monitored refolding rate constants of fast phase (red circles) and slow phase (blue circles) of GroEL-assisted refolding of MSG obtained from the respective double exponential fits of refolding at different GroEL concentrations (conc.). d, effect of GroEL concentration on their corresponding relative amplitudes. Relative amplitudes of the fast and slow phases monitored by ANS fluorescence were calculated with respect to the total ANS fluorescence change observed for the red curve (i.e. relative to the sum of both fast and slow phases). For the tryptophan fluorescence change, relative amplitudes were plotted using the linearly extrapolated unfolding base line in a. Nearly 70% of the tryptophan fluorescence change occurs in the burst phase. In c and d, the error bars represent the spread of measurements made in three separate experiments.

