Background: Hypoxia regulates the transport systems expression in kidney cells.
Results: Expression of SGLT1 and SGLT2 is diminished in LLC-PK1 cells exposed to low oxygen concentrations.
Conclusion: HIF-1α modified expression of the renal transporters SGLT1 and SGLT2 in LLC-PK1 cells.
Significance: HIF-1 regulates the expression of glucose transport in LLC-PK1 cells, and this mechanism may be involved in the adaptation of kidney cells under reductions conditions in pO2.
Keywords: Glucose Transport, Hypoxia, Hypoxia-inducible factor (HIF), Kidney Metabolism, Renal Physiology, GLUT1, Renal Glucose Transporters, SGLT1, SGLT2
Abstract
In this work, we demonstrated the regulation of glucose transporters by hypoxia inducible factor-1α (HIF-1α) activation in renal epithelial cells. LLC-PK1 monolayers were incubated for 1, 3, 6, or 12 h with 0% or 5% O2 or 300 μm cobalt (CoCl2). We evaluated the effects of hypoxia on the mRNA and protein expression of HIF-1α and of the glucose transporters SGLT1, SGLT2, and GLUT1. The data showed an increase in HIF-1α mRNA and protein expression under the three evaluated conditions (p < 0.05 versus t = 0). An increase in GLUT1 mRNA (12 h) and protein expression (at 3, 6, and 12 h) was observed (p < 0.05 versus t = 0). SGLT1 and SGLT2 mRNA and protein expression decreased under the three evaluated conditions (p < 0.05 versus t = 0). In conclusion, our results suggest a clear decrease in the expression of the glucose transporters SGLT1 and SGLT2 under hypoxic conditions which implies a possible correlation with increased expression of HIF-1α.
Introduction
Hypoxia-inducible factor 1α (HIF-1α)3 expression is a key response to low oxygen partial pressure among mammalian cells (1). HIF-1α has a short half-life (of approximately 5–8 min) in normoxia (2) because it is hydroxylated by prolyl hydroxylase, bound to von Hippel-Lindau protein and then degraded by the E3 ubiquitin-ligase complex (3). By contrast, hypoxia promotes a decrease in prolyl hydroxylase activity; HIF-1α is then phosphorylated by AKT1 and translocated to the nucleus, where it binds directly to HIF-1β to form the HIF-1 dimer (4). The dimer is coupled to a hypoxia response element in a DNA promoter region that facilitates the transcription of a wide variety of genes involved in the regulation of cell survival such as those involved in iron metabolism (5), intracellular glucose homeostasis (6), metabolism, and nucleoside transport (7). Besides the wide range of genes whose transcription is induced by HIF-1, this protein is also crucial in cellular adaptation to stress.
There is evidence of high level HIF-1 expression among mammals suffering from diverse pathological conditions such as cancer (8) and diabetes (9). HIF-1 expression has been found to be increased in human malignancies such as prostate, cervical, renal cell, colon, lung, brain, and breast cancer. Tumor development as well as angiogenesis and patient mortality have been correlated with increased expression of HIF-1 (10). However, Rosenberger et al. found that the development of diabetic nephropathy is accompanied by chronic hypoxia and tubulointerstitial fibrosis, conditions that are associated with an increased expression of HIF-1α in diabetic kidneys (9). Since Takiyama et al. proposed in 2011 that HIF-1 may have cytoprotective properties, it is not quite clear whether HIF-1 has a beneficial role or can only be a marker for disease progression (11).
Clinical studies have shown that renal glucose metabolism is modified in diabetic, hypertensive, and atherosclerotic patients (12, 13). These diseases frequently lead to renal ischemia and acute and or chronic renal failure, conditions characterized by low tissue perfusion that results in hypoxia (12). Evidence confirms that HIF-1 is expressed in renal tissue in experimental conditions (14). High glucose in renal tissues induces oxidative stress (15) and glucose transport alterations (9, 16) and greatly decreases intracellular ATP concentrations (17) as well as the expression of enzymes involved in oxidative pathways (18), resulting in HIF-1α stability and consequently more HIF-1 production.
Under chemical hypoxia induced with cobalt chloride (CoCl2) or dimethyloxalylglycine, the rodent kidney expresses HIF-1α specifically in the renal cortex and inner and outer medulla. This HIF-1α expression is accompanied by the co-detection of HIF-1-regulated proteins, such as vascular endothelial growth factor (VEGF) and glucose transporter 1 (GLUT1) (16, 19, 20) Also, in streptozotocin-induced diabetic rats, high levels of HIF-1α were found in the outer medullary region, including the medullary thick ascending limb (9). In kidney cells, HIF-1 regulates glucose transport via GLUT1 and GLUT3, and glucose metabolism mediated by enzymes such as fructose-2, 6-biphosphatase and hexokinase 2, resulting in a high rate of glucose turnover and increased oxidative metabolism (21). Also, cytokines such as IL-1β in human proximal tubule cells induce HIF-1 and VEGF activities, as evidenced by measuring their mRNA and protein expression, as well as the increased expression of genes that are up-regulated by HIF (22). In addition, results from our laboratory have shown that cytokines and high glucose concentration regulate the expression of SGLT2 (23), which suggests that a common HIF-1-mediated pathway is shared by high glucose, cytokine effects, and hypoxia in the proximal tubule.
To evaluate a possible role of HIF-1α protein in renal damage/protection mechanisms under low oxygen partial pressure we performed a hypoxia model where renal epithelial cells were exposed to 0 and 5% O2. We propose that HIF-1α regulates glucose transporter expression in the cultured epithelial renal cell line LLC-PK1 subjected to hypoxia.
EXPERIMENTAL PROCEDURES
LLC-PK1 Cell Culture Method
LLC-PK1 cells are a well differentiated epithelial cell line derived from porcine proximal tubule cells; this strain has been widely used as a model system for studying regulation of glucose transport and the regulation of the HIF-1. The cells form a confluent monolayer with characteristic tight junctions and microvillus and express several proximal tubule marker enzymes (24). The main feature from this tubular segment, the distal portion of the proximal tubule, is a well characterized unidirectional transepithelial transport that includes glucose, phosphate, and amino acids. Salt and water transport from apical to basolateral surface induce the formation of typical blisters or domes easily detected by light microscopy (23–25). Noteworthy, this cell line expresses HIF-1 in response to inflammatory molecules and is used to demonstrate regulation in the expression of this protein (26)
LLC-PK1 cells (CRL-2190, ATCC) from the 124th passage were grown in Dulbecco's modified Eagle's medium (DMEM; GIBCO-BRL) plus Ham's F-12 (GIBCO) medium in a 1:1 (v/v) mixture, supplemented with 10% (v/v) fetal bovine serum (FBS; GIBCO), 2 mm l-glutamine, 15 mm HEPES, 100 units/ml penicillin, and 100 μg/ml streptomycin, pH 7.4. Cells were incubated in an atmosphere of 5% CO2 and 95% humidity at 37 °C until monolayers were formed. When monolayers were confluent, a 0.125% trypsin and 0.5 mm EDTA solution was added, and the cells were incubated for 10 min. Cells were then harvested and suspended in fresh medium for subculture in either 25-cm2 (1.0 × 10⁶ cells) or 75-cm2 (2.5 × 10⁶ cells) polystyrene flasks (Costar, Corning).
In Vitro Hypoxia Assays
LLC-PK1 cells were seeded at a density of 2.5 × 10⁶ cells in 75-cm2 and 1 × 10⁶ cells in 25-cm2 flasks and grown for 72 h at 37 °C to attain at least 80% confluence. The flasks were then placed in a sealed modular hypoxic chamber (Billups Rothenberg, Del Mar, CA) flushed with different oxygen (O2) percentages. Mixture 0% O2 was composed of 95% N2 and 5% CO2 (Infra). Mixture 5% O2 was 5% O2, 5% CO2, and 90% N2 (Infra). Next, the chamber was placed in an incubator at 37 °C for 1, 3, 6, and 12 h without O2 or with a 5% O2 mixture. Chemical hypoxia was induced with different concentrations of CoCl2 at different times. The effect of CoCl2 concentration on LLC-PK1 cells was evaluated by exposing the cells to 0–500 μm CoCl2 for 12 h. The effect of time of exposure was assessed with 300 μm CoCl2 for 0, 1, 3, 6, and 12 h. Cells not exposed to hypoxia were run in parallel as controls. The cells in 75-cm2 flasks were used to determine protein expression, and those in 25-cm2 flasks were used to determine mRNA levels.
Effect of Albendazole on in Vitro Hypoxia Assays
Albendazole (ABZ) is a well known HIF-1α inhibitor (27). In our model we evaluated the effect of hypoxia on the cells using this compound as an inhibitor of the expression of HIF-1α. Cells under the same conditions for control and hypoxia monolayers were treated with ABZ at 0, 0.1, and 1 μm concentrations before being placed in their respective environmental chamber and flushed with 0% O2 or with added CoCl2 (300 μm) for 6 h. The cells were then processed as described above for protein determination.
Cell Homogenate Preparations
After incubation with the respective gas mixtures or CoCl2, cell monolayers were placed on an ice bath and washed immediately with ice-cold phosphate-buffered saline (PBS, 138 mm NaCl, 3 mm KCl, 8.1 mm Na2HPO4, 1.5 mm KH2PO4, pH 7.4). The monolayers were then detached with a scraper, collected in 5 ml of ice-cold PBS, and washed at 400 × g for 5 min. Cells were concentrated by centrifugation at 600 × g at 4 °C for 5 min, and the cell pellet was then resuspended in 500 μl of ice-cold lysis solution (150 nm NaCl,1 mm EDTA, 10 mm Tris-HCl, pH 7.4, 1% Triton X-100, 0.1% SDS, 0.1 mm PMSF, and a mixture of protease inhibitors diluted 1:25 (v/v) (Sigma). Cell suspension was then homogenized by pipetting up and down until completely dissolved and subsequently incubated at 4 °C for 10 min. Cell debris, nuclei, and heavy organelles were removed by centrifugation at 13,000 × g, for 10 min at 4 °C, and supernatant aliquots were taken and stored at −80 °C until use. A separate 50-μl aliquot was taken for protein determination using the bicinchoninic acid assay.
Protein Determination
Total protein content was determined by the bicinchoninic acid assay method using a commercial kit (Pierce). Standard curves were prepared with bovine γ-globulin from 5 to 100 μg/ml protein. Standard curves were repeated every time when new samples were determined, with each point of the curve done in triplicate. Each sample was performed in triplicate for every homogenate. Once protein was determined, the protein concentration in final samples was adjusted with lysis solution to 3 μg/μl. Spectrophotometric readings were performed at λ = 570 nm in an ELx800 microplate reader (BioTek Instruments, Winooski, VT).
Western Blot Assays
Western blot assays were performed immediately after protein determination; 30 μg of total protein per sample was used for each SDS-PAGE lane, and electrophoresis was carried out for 120 min. Once finished, the lanes were transferred to nitrocellulose membranes in a semi-dry Trans-Blot Cell (Bio-Rad). The membranes were then incubated with fresh TBS-T buffer (20 mm Tris-HCl, 150 mm NaCl, pH 7.5, plus 0.5% Tween 20) containing 5% bovine serum albumin, for 1 h at room temperature. Membranes were washed thoroughly in TBS-T buffer and incubated overnight at 4 °C with the corresponding primary antibody to HIF-1α, SGLT1, SGLT2, and GLUT1 (dilution 1:500, 1:600, 1:600, and 1:500, respectively). The β-actin antibody (dilution 1:7500) was used as a control. The membranes were then washed three times with TBS-T buffer. Immunodetection was performed with the use of HRP-secondary antibody diluted 1:11,000 (anti-mouse to HIF-1α), 1:13,000 (anti-goat to SGLT1 and SGLT2), 1:11,000 (anti-goat to GLUT1), 1:20,000 (anti-mouse to β-actin) followed by chemiluminescence detection (SuperSignal West Pico). Blots were contrasted to β-actin bands and results expressed as -fold versus the control value (100%).
mRNA Detection by Reverse Transcription (RT) and Polymerase Chain Reaction (PCR)
The effects of hypoxia on HIF-1α, SGLT1, SGLT2, and GLUT1 mRNA in LLC-PK1 cells were evaluated by semiquantitative RT-PCR. Total RNA was isolated with TRIzol (Invitrogen), and cDNA was synthesized using 2 μg of total RNA, 0.5 μg of oligo(dT)15 primers, and 200 units of MMLV reverse transcriptase at 38 °C for 60 min.
PCR amplification of 1 μg of cDNA used 1.5 mm MgCl2, 0.2 mm dNTP mix, 1.5 IU of Taq polymerase, and a 0.25 μm concentration of each specific primer (see below). After an initial incubation at 94 °C for 3 min, 30 amplification cycles consisting of 94 °C for 45 s, 30 s at annealing temperature (see below), and a 90-s extension were followed by a final extension at 72 °C for 10 min. Annealing was at 56 °C for HIF-1α, 57 °C for SGLT1, SGLT2, and r18S and 58 °C for GLUT1. The gene-specific primers used to selectively amplify genes were as follows: HIF-1α, 5′-CTC-AAA-GTC-GGA-CAG-CCT-CA-3′ (forward) and 5′-CCC-TGC-AGT-AGG-TTT-CTG-CT-3′ (reverse); SGLT1, 5′-ATG-GAC-AGT-AGC-ACC-TTG-AGC-C-3′ (forward) and 5′TAG-CCC-CAG-AGA-AGA-TGT-CTG-C-3′ (reverse); SGLT2, 5′-CCA-ATA-GAG-GCA-CAG-TTG-GTG-G-3′ (forward) and 5′-GCG-TAA-ATG-TTC-CAG-CCC-AGG-3′ (reverse); GLUT1, 5′-AAG-TCT-CCT-TTA-CCC-ACA-TCC-3′ (forward) and 5′-GAG-TGT-CCG-TGT-CTT-CTT-GAG-T-3′ (reverse); 18S, 5′-CGA-CGA-CCC-ATT-CGA-ACG-TCT-3′ (forward) and 5′-GCT-ATT-GGA-GCT-GGA-ATT-ACC-G-3′ (reverse).
PCR products were separated by electrophoresis in 1.5% agarose gels and stained with ethidium bromide. Scanning densitometry in a Gel Doc XR System from Bio-Rad with Quantity-One one-dimensional Analysis Software, version 4.6.1, was used for a semiquantitative assessment of band densities.
Viability Assay
LLC-PK1 cell viability was evaluated with the Cell Titer 96 Aqueous Non-Radioactive Cell Proliferation kit. The number of metabolically active cells was determined by the ability of cells to reduce the tetrazolium compound (MTS) and the electron coupling reagent (phenazinemethosulfate) into formazan. Monolayers grown in 96-well plates at a density of 105 cells/well were incubated for 24 h, and the medium was exchanged with serum-free medium 1 h before cells were exposed to hypoxia (0% O2) or CoCl2 for 0, 1, 3, 6, and 12 h. This was followed by the addition of 20 μl/well of a mixture MTS/phenazinemethosulfate (1:20). After 1 h at 37 °C in a humidified, 5% CO2 atmosphere, the absorbance at 490 nm was determined in a microplate reader (BioTek).
Determination of Glucose in the Media
To determine the medium glucose concentration of LLC-PK1 cell monolayers under hypoxic conditions in a time-dependent manner, 2.5 × 10⁵ cells/well were seeded in 24-well plates and incubated under conditions of 0% O2 and 300 μm CoCl2 for 0, 1, 3, 6, and 12 h. Next, 500 μl of culture medium was collected and clarified by centrifugation before the concentration of glucose was quantified using a glucose oxidase-peroxidase (GOD/POD) assay kit (Elitech). Briefly, 0–50 mg/ml glucose standard calibration curves were prepared as a reference, and 10 μl of medium of each sample was incubated with the reaction assay buffer containing glucose oxidase-peroxidase enzymes at 37 °C for 15 min. Absorbances for both standard and samples were measured at 490 nm.
Materials
DMEM, Ham's F-12 medium, and FBS were obtained from Invitrogen. SuperSignal West Pico reagents and detection system were obtained from Pierce Thermo Fisher. Molecular weight markers and electrophoresis reagents were purchased from Bio-Rad. Antibodies to HIF-1α, SGLT1, SGLT2, and GLUT1 were purchased from Santa Cruz Biotechnology. Monoclonal anti-β-actin, polyclonal anti-goat-HRP, TNFα, and other chemicals and materials were from Sigma-Aldrich.
Data Analysis
All values are expressed as the mean ± S.D. Protein and mRNA expression values were evaluated by one-way analysis of variance followed by post hoc Dunnett and Bonferroni tests, using SigmaStat software v11.2. (Systat Software). Differences were considered statistically significant at p < 0.05.
RESULTS
Time Course of Effect of Hypoxia, 0 and 5% O2, on HIF-1α mRNA and Protein Expression
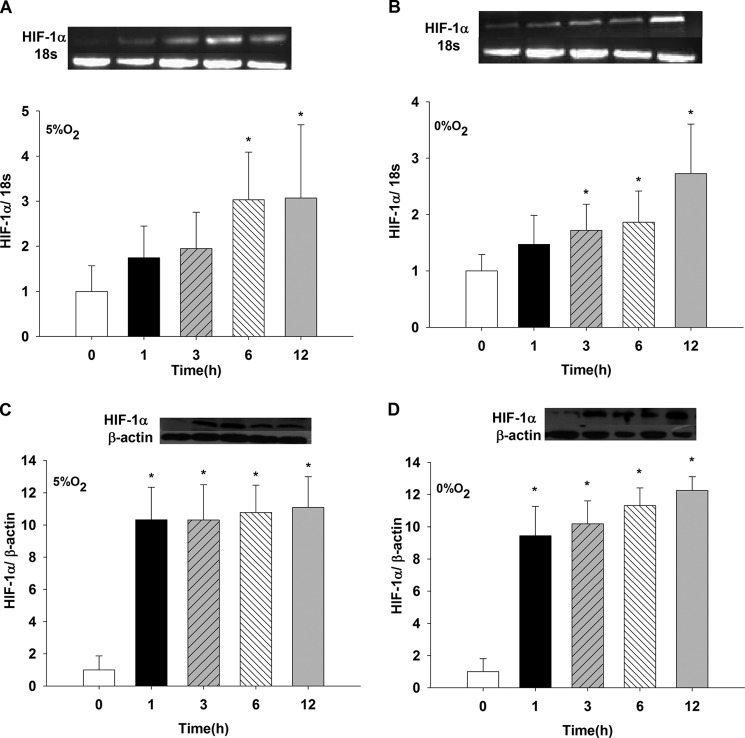
LLC-PK1 cells monolayers exposed to 5% O2 showed increased HIF-1α mRNA expression at 6 and 12 h compared with that at t = 0 (p < 0.05) (Fig. 1A). Incubation of cells in 0% O2 (Fig. 1B) showed a significant increase in HIF-1α mRNA expression at 3, 6, and 12 h compared with t = 0 (p < 0.05). No effect was observed for 1 h (data not shown). HIF-1α protein increased nearly 10 times with a 1-h exposure to 5% O2 compared with t = 0 (p < 0.05). The effect was sustained at 3, 6, and 12 h versus t = 0 h (p < 0.05) (Fig. 1C), whereas no differences were observed in these results compared with 1 h. Fig. 1D shows a similar augmentation in HIF-1α protein at 1, 3, 6, and 12 h (p < 0.05 versus t = 0); however, at 12 h, the protein values increased compared with 1 h (p < 0.05).
FIGURE 1.
Induction of mRNA and protein expression of HIF-1α in LLC-PK1 cells under conditions of low oxygen (5% O2 and 0% O2). LLC-PK1 cells were exposed to hypoxia, 5% O2 (A and C) and 0% O2 (B and D), for 1, 3, 6, and 12 h. mRNA HIF-1α was determined by PCR and HIF-1α protein by Western blotting (*, p < 0.05 versus t = 0 h). Values are means ± S.D. (error bars) for six independent experiments, each in duplicate.
Effect of CoCl2 on HIF-1α mRNA and Protein Expression
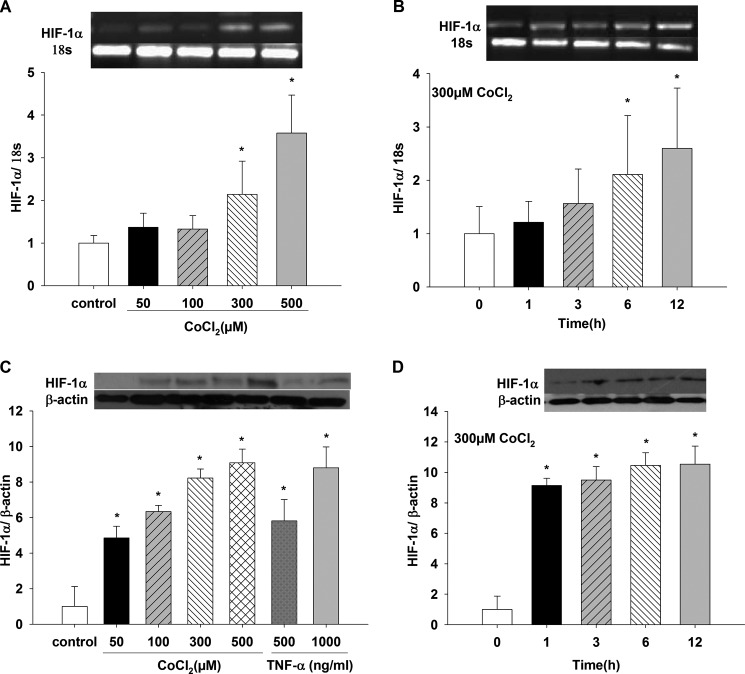
Fig. 2A shows a concentration-dependent effect on HIF-1α mRNA expression when cells were incubated with different CoCl2 concentrations for 12 h. HIF-1α mRNA increased with 300 and 500 μm CoCl2 compared with control (p < 0.05); 50 and 100 μm CoCl2 did not produce any effect on HIF-1α mRNA expression (data not shown). HIF-1α protein increased in a dose-dependent manner with increasing CoCl2 concentrations (Fig. 2C) for 12 h (p < 0.05 for 50, 100, 300, and 500 μm CoCl2 versus control). Thus, we chose 300 μm CoCl2 in further experiments. In addition, as a positive control, two TNFα concentrations, 500 and 1000 ng/ml, significantly induced HIF-1α protein expression compared with control values (p < 0.05). The increase of HIF-1α protein induced with 1000 ng/ml TNFα was similar to the one obtained with 300 and 500 μm CoCl2 (data not shown and Fig. 2C). Incubation with 300 μm CoCl2 (Fig. 2B) increased HIF-1α mRNA expression only at 6 and 12 h versus t = 0 (p < 0.05). In the presence of 300 μm CoCl2, protein expression was also time-dependent (Fig. 2D); between 1 and 6 h, there was almost a 9-fold increase (1 and 3 h versus t = 0 h, p < 0.05), and between 6 and 12 h, protein levels increased 10–12-fold (p < 0.05 versus t = 0).
FIGURE 2.
Induction of mRNA and protein expression of HIF-1α in LLC-PK1 cells under chemical hypoxia with CoCl2. LLC-PK1 cells were treated for 12 h with different CoCl2 concentrations (50, 100, 300, and 500 μm). A and C, changes in HIF-1α mRNA (A) and protein (C) expression were determined by PCR and Western blotting, respectively (*, p < 0.05 versus control). B and D, changes in HIF-1α mRNA (B) and protein (D) expression in LLC-PK1 cells incubated with 300 μm CoCl2 for 1, 3, 6, and 12 h were assessed by PCR and Western blotting, respectively (*, p < 0.05 versus t = 0 h). Values are means ± S.D. (error bars) for six independent experiments, each in duplicate.
Effect of Hypoxia, 0 and 5%O2, on SGLT1 and SGLT2 mRNA and Protein Expression
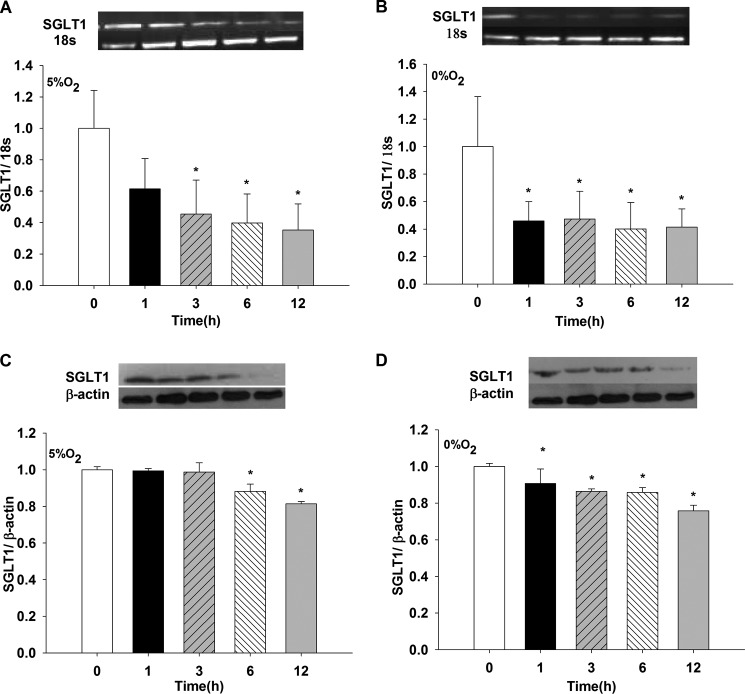
SGLT1 mRNA decreased when cells were exposed to either 0% or 5% O2 compared with t = 0 for 3, 6, and 12 h (p < 0.05 versus t = 0 h with 5% O2) and for 1, 3, 6, and 12 h versus t = 0 h with 0% of O2 (p < 0.05) (Fig. 3, A and B, respectively). No differences were found when the two O2 concentrations were compared at their respective times (data not shown, n = 6).
FIGURE 3.
Effects of hypoxia (5% O2 and 0% O2) on SGLT1 mRNA and protein expression in LLC-PK1 cells. LLC-PK1 monolayers were incubated in 5% O2 (A and C) and 0% O2 (B and D) for 1, 3, 6, and 12 h. SGLT1 mRNA and protein were evaluated by PCR and Western blotting, respectively (*, p < 0.05 versus t = 0 h). Values are means ± S.D. (error bars) for six independent experiments, each in duplicate.
SGLT1 protein decreased when cells were exposed to either 0% or 5% O2 compared with t = 0 for 6 and 12 h versus 0 h with 5% O2 and for 1, 3, 6, and 12 h versus t = 0 h with 0% O2 (p < 0.05) (Fig. 3, C and D, respectively). No differences were found when the two O2 concentration were compared at their respective times (data not shown, n = 6).
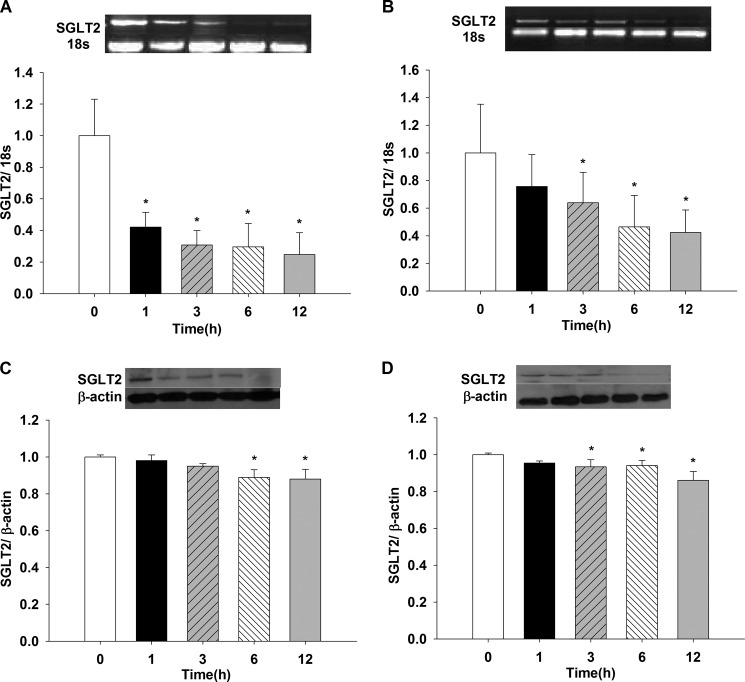
Fig. 4A shows the effect of 5% O2 on LLC-PK1 SGLT2 mRNA. A 60% reduction in mRNA was observed as of 1-h incubation, the effect persisted until or up to 12 h (1, 3, 6 and 12 h versus t = 0, p < 0.05). Incubation with 0% O2 showed a time-dependent decreasing pattern at 3, 6, and 12 h compared with t = 0 (p < 0.05) (Fig. 4B), where no change was observed for 1-h incubation (data not shown).
FIGURE 4.
Effects of hypoxia (5% O2 and 0% O2) on SGLT2 mRNA and protein expression in LLC-PK1 cells. LLC-PK1 monolayers were incubated in 5% O2 (A and C) and 0% O2 (B and D) for 1, 3, 6, and 12 h. SGLT2 mRNA and protein were evaluated by PCR and Western blotting, respectively (*, p < 0.05 versus t = 0 h). Values are means ± S.D. (error bars) for six independent experiments, each in duplicate.
SGLT2 protein decreased when cells were exposed to either 0% or 5% O2 compared with t = 0 (black bars) for 6 and 12 h versus 0 h with 5% O2 and for 3, 6, and 12 h versus 0 h with 0% O2 (p < 0.05) (Fig. 4, C and D, respectively). No differences were found when the two O2 concentrations were compared (data not shown, n = 6).
Effect of CoCl2 on SGLT1 and SGLT2 mRNA and Protein Expression
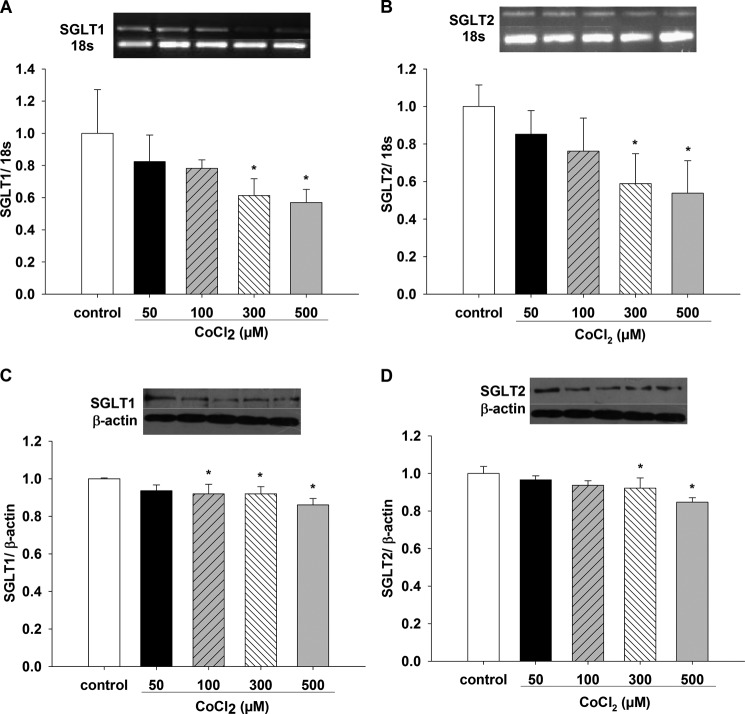
Fig. 5, A and B, shows that SGLT1 and SGLT2 mRNA decreased with exposure to 300 and 500 μm CoCl2 for 12 h compared with controls (p < 0.05 versus control, n = 6). Fig. 5C shows that SGLT1 protein expression decreased in a dose-dependent manner when cells were incubated with different CoCl2 concentrations for 12 h (100, 300, and 500 μm CoCl2 versus control, p < 0.05, n = 6), whereas SGLT2 protein decreased with 300 and 500 μm CoCl2 for 12 h compared with control (p < 0.05, n = 6) (Fig. 5D).
FIGURE 5.
Effects of chemical hypoxia with CoCl2 on SGLT1 and SGLT2 mRNA and protein expression in LLC-PK1 cells. Changes in SGLT1 and SGLT2 expression in LLC-PK1 cells treated for 12 h with different CoCl2 concentrations (50, 100, 300, and 500 μm) were evaluated for mRNA (A and B) by PCR and for protein (C and D) by Western blotting (*, p < 0.05 versus control). Values are means ± S.D. (error bars) for six independent experiments, each in duplicate.
Effect of Hypoxia, 0 and 5% O2, on GLUT1 mRNA and Protein Expression
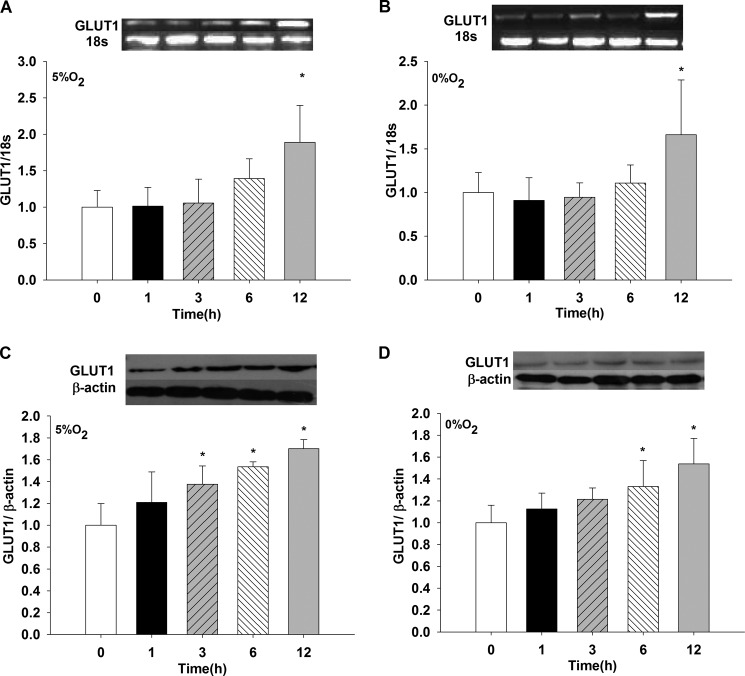
When the GLUT1 transporter was evaluated under similar conditions as were SGLT1 and SGLT2, mRNA increased 2-fold at 5 and 0% O2 for 12 h, compared with t = 0 (p < 0.05, n = 6) (Fig. 6 A and B). At 1, 3, and 6 h, values did not differ from t = 0 (data not shown, n = 6). GLUT1 protein expression showed a time-dependent course at 5% O2, with significant high values observed at 3, 6, and 12 h when contrasted with t = 0 (p < 0.05, n = 6) (Fig. 6C). At 0% O2, significant high values were obtained for 6 and 12 h versus t = 0 (Fig. 6D). No significant values were observed for 1 and 3 h (data not shown, n = 6).
FIGURE 6.
Effects of hypoxia (5% O2 and 0% O2) on GLUT1 mRNA and protein expression in LLC-PK1 cells. LLC-PK1 monolayers were incubated in 5% O2 (A and C) and 0% O2 (B and D) for 1, 3, 6, and 12 h. GLUT1 mRNA and protein were determined by PCR and Western blotting, respectively (*, p < 0.05 versus t = 0 h). Values are means ± S.D. (error bars) for six independent experiments, each in duplicate.
Effect of CoCl2 on GLUT1 mRNA and Protein Expression
CoCl2 concentrations of 0, 50, 100, 300, and 500 μm were tested on GLUT1 mRNA and protein expression. mRNA was increased at 300 and 500 μm compared with control (p < 0.05, n = 6); 50 and 100 μm CoCl2 did not change mRNA values (data not shown, n = 6) (Fig. 7A). Protein expression was increased at 300 and 500 μm CoCl2 contrasted with control (p < 0.05, n = 6); 50 and 100 μm CoCl2 did not show significant changes compared with control (data not shown, n = 6) (Fig. 7B).
FIGURE 7.
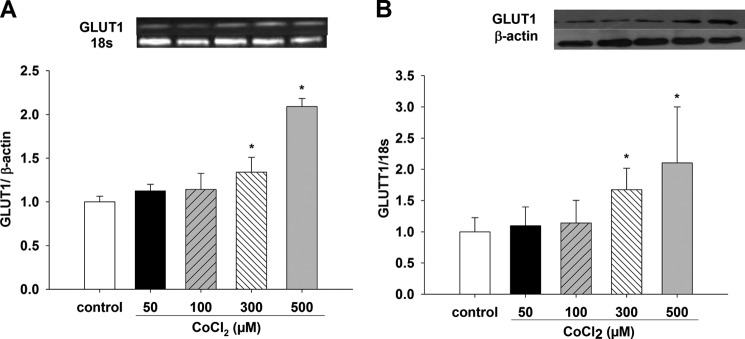
Effects of chemical hypoxia with CoCl2 on GLUT1 mRNA and protein expression in LLC-PK1 cells. Changes in GLUT1 mRNA and protein expression in LLC-PK1 cells were evaluated under conditions of chemical hypoxia for 12 h with different CoCl2 concentrations (50, 100, 300, and 500 μm). GLUT1 mRNA (A) and protein (B) were determined by PCR and Western blotting, respectively (*, p < 0.05 versus control). Values are means ± S.D. (error bars) for six independent experiments, each in duplicate.
Effect of ABZ, Hypoxia, and CoCl2 on HIF-1α and GLUT1
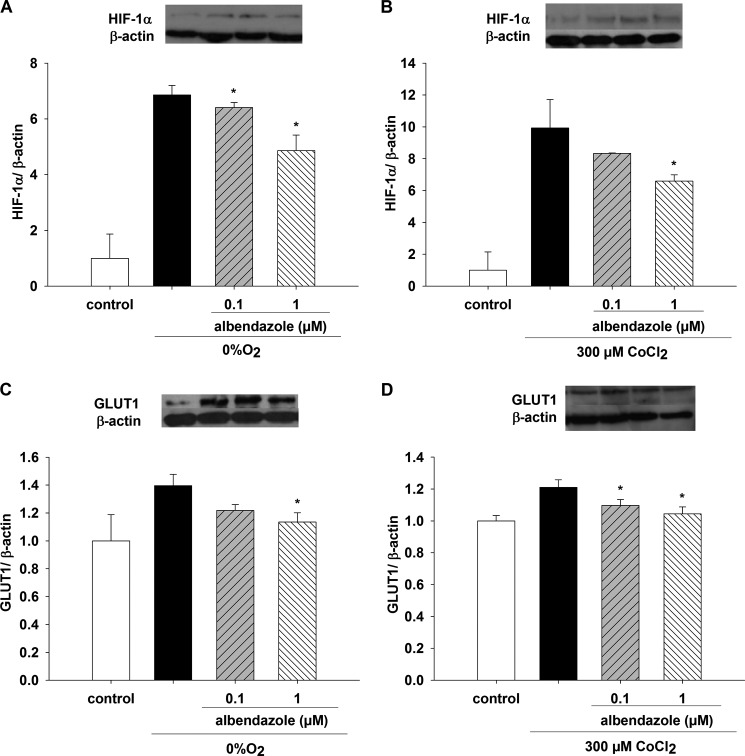
ABZ, 0.1 and 1.0 μm, inhibited HIF-1α protein expression when cell monolayers were incubated with 0% O2 for 6 h (Fig. 8A). Both concentrations were different compared with the observed increase in HIF-1α at 0% O2 (p < 0.05, n = 6). HIF-1α was augmented 7-fold compared with control value incubated at 20% O2 for 6 h (p < 0.05, n = 6). HIF-1α Western blot assays showed a decrease in protein expression at 1.0 μm ABZ and 300 μm CoCl2 compared with the increase in HIF-1α at 300 μm CoCl2 (p < 0.05, n = 6) (Fig. 8B); 0.1 μm CoCl2 did not show a significant effect (data not shown, n = 6) (Fig. 8B). ABZ at 1.0 μm significantly decreased GLUT1 protein expression (Fig. 8C) when incubated at 0% O2 for 6 h and compared with the augmented GLUT1 expression under the same conditions. ABZ at 0.1 and 1.0 μm in the presence of 300 μm CoCl2 inhibited the increased GLUT1 protein expression in the presence of 300 μm CoCl2 without ABZ (p < 0.05, n = 6) (Fig. 8D).
FIGURE 8.
Effect of ABZ on HIF-1α and GLUT1 protein expression under hypoxia in LLC-PK1 cells. LLC-PK1 monolayers were preincubated for 1 h with 0.1 and 1 μm ABZ. Changes in HIF-1α and GLUT1 expression were evaluated under conditions of 0% O2 (A and C) or 300 μm CoCl2 (B and D) for 6 h. HIF-1α (A and B) and GLUT1 proteins (C and D) were determined by Western blotting (*, p < 0.05 versus 0% O2 or 300 μm CoCl2, in absence of ABZ). Values are means ± S.D. (error bars) for six independent experiments, each in duplicate.
Viability Assay
Cell viability was monitored for all the exposure times to either 0% O2 or 300 μm CoCl2, and the results are shown in Table 1. No reduction in cell viability was observed for 0% O2 at any time: 1, 3, 6, and 12 h (data not shown, versus t = 0 and its respective incubation time). However, 300 μm CoCl2 caused a reduction in cell viability after a 1-h incubation, which persisted up to 12 h (p < 0.05). Compared with its respective time, a significant reduction in cell viability was observed (p < 0.05).
TABLE 1.
Viability assay in LLC-PK1 cells
LLC-PK1 cell viability was evaluated under hypoxia conditions (0% O2 and 300 μm CoCl2) for 0, 1, 3, 6, and 12 h. Values are means ± S.D. for three independent experiments done in triplicate.
| Hypoxia conditions | Time (h) |
p | ||||
|---|---|---|---|---|---|---|
| 0 | 1 | 3 | 6 | 12 | ||
| Control | 100 ± 17.54 | 100 ± 20.40 | 100 ± 9.71 | 100 ± 8.40 | 100 ± 27.00 | |
| Oxygen (0%) | 100 ± 16.96 | 93.12 ± 16.48 | 104.51 ± 16.77 | 101.14 ± 8.83 | 95.15 ± 7.71 | NSa |
| CoCl2 (300 μm) | 100 ± 17.68 | 68.06 ± 6.61 | 77.92 ± 22.56 | 65.59 ± 13.28 | 50.27 ± 11.51 | <0.05 vs. respective time |
a NS, not significant.
Glucose Concentrations in the Medium under Hypoxia
To determine glucose concentration in the medium at different times, we measured the glucose concentration after 1, 3, 6, and 12 h (Fig. 9). Cells under control conditions showed decreased glucose concentration in the medium between 3 and 12 h (p < 0.05 versus t = 0). The effect of 300 μm CoCl2 at 1 h was decreased from t = 0 and 1 h for control and 0% O2 values (p < 0.05 versus t = 0; p < 0.05 versus control 1 h and 0% O2 1 h). From 3 to 12 h, 0% O2 and 300 μm CoCl2 significantly diminished glucose concentration compared with t = 0 and with their respective controls (p < 0.05).
FIGURE 9.
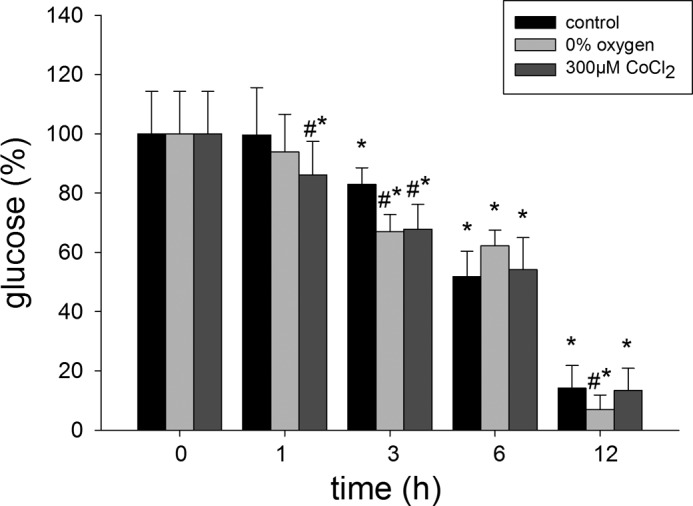
Effects of hypoxia (0% O2) and chemical hypoxia (CoCl2) on glucose concentrations in the medium LLC-PK1 cell cultures. LLC-PK1 monolayers were incubated in the presence of 0% O2 or 300 μm CoCl2 for 0, 1, 3, 6, and 12 h. A 500-μl aliquot of culture medium was collected, and the concentration of glucose was quantified (*, p < 0.05 versus t = 0; #, p < 0.05 versus control at all time points). Values are means ± S.D. (error bars) for three independent experiments, each done in triplicate.
DISCUSSION
HIF-1α is considered a key molecule for many intracellular responses mediated by hypoxia in many tissues including the kidney (28). In this study, we found that HIF-1α was increased under hypoxia in a model of epithelial tubular proximal cells in culture. These findings correlated with a decrease in the expression of renal SGLT glucose transporters. We also confirmed that GLUT1 expression is increased in these cells when HIF-1α is stimulated by hypoxia. Similar results for GLUT1 have been reported in kidney cells, nucleus pulposus cells of the rat intervertebral disk, and in mouse and human β cells from Langerhans islets (29, 30).
For this study we used two general methods to test the effects of hypoxia on cell cultures. First, CoCl2 salts have been widely proposed as a chemical-induced hypoxia method, thus we included these assays as a positive control for the expression HIF-1α. In addition, CoCl2 salts have the advantage of being a rapid and inexpensive maneuver to induce concentration-dependent hypoxic states in cultured cells (27, 31).
However, to be sure that low pO2 (0 and 5%) contributes to HIF expression we induced air hypoxia by means of modular incubator chambers. Hypoxic chambers have the advantage of not using drugs that can disrupt cell biochemistry reactions or interact with cellular organelles not directly involved in oxygen intracellular tension. Because HIF-1α can be expressed constitutively under normoxia in some cell lines (1, 8, 10), it is critical to compare low pO2 versus normoxic conditions (16%) to determine the basal level of HIF in these cell lines (26). Thus, in our experimental conditions we used low pO2 (0 and 5%) because only pO2 <1.0% caused hypoxia in the isolated proximal tubule (32, 33).
In our results low concentrations of O2 induced an increase in HIF-1α protein and mRNA expression. These results were more pronounced when 0% O2 was used. In fact, very low concentrations of O2 (<0.5%) induce HIF-1α expression in renal tissues (34). With 0% O2, mRNA expression showed a time-dependent pattern, whereas protein HIF-1α increased maximally after 1 h, and the response was maintained for 12 h. In our work, maximal time-dependent responses for protein expression from 1 to 12 h at 0 and 5% O2 can be explained by the inhibition of the HIF-1α protein degradation process normally stimulated by low oxygen concentrations (35). The results for mRNA did not correlate with HIF-1α protein expression; one possible explanation is that basal activities of hydroxylases and von Hippel-Lindau initially inactivate protein expression, until the mRNA rate of synthesis surpasses the pool reserves of von Hippel-Lindau and associated proteins. We also suggest that other factors (for example TNFα and IL-1β) may contribute to this mechanism. These cytokines are present in this renal cell line; in pathological conditions such as is the case with inflammatory processes in human proximal tubular epithelial cells and in retinal cells, HIF-1α is increased (22, 23, 36).
To confirm that hypoxia is responsible for the induction of HIF-1α protein we performed experiments in the presence of CoCl2. The use of CoCl2 has been well documented as a model of chemical hypoxia in in vitro and in vivo models (27). Our results indicated that CoCl2 had similar effects on mRNA and protein expression as 0 and 5% O2. Evidence indicates that the use of CoCl2 modified HIF-1α in the kidney of rats (16, 19). Sandau et al. demonstrated that TNFα in LLC-PK1 cells induced HIF-1α protein expression (26). In our model, 500 and 1000 ng/ml TNFα confirmed an increased HIF-1α protein expression, and such experiments suggest that other factors present in the medium and released by hypoxia may also induce changes in HIF-1α protein expression (IL-1β, TNFα, angiotensin II, and endothelin-1). Thus, taking these results together, it is clear that hypoxia increased HIF-1α mRNA and protein expression in our model directly or mediated by other factors.
We and others have proposed that renal glucose transporters responsible for the recovery of the sugar from the tubular proximal fluid may be regulated by high glucose concentrations and cytokines. In this sense, Ohta et al. (24) demonstrated a decreased expression of SGLT1 and GLUT1 mRNA in LLC-PK1 cells exposed to high concentrations of glucose (25 mm). Furthermore, we recently reported that SGLT2 mRNA expression increased under high glucose (25 mm). These effects are also attained with IL-6 (10 pg/ml) and TNFα (10 pg/ml) on SGLT1 mRNA expression and SGLT2 mRNA and protein expression (23). Thus, it is likely that HIF-1α is involved in the changes in renal glucose transporters shown by hypoxia, high glucose, and cytokines.
Epithelial glucose transporters may undergo changes at the transcriptional level as a result of high glucose concentrations. Specifically, the mRNA expression of GLUT1 and SGLT1 decreased when LLC-PK1 cells were incubated with 25 mm d-glucose (25). Our results showed that both chemical and low O2 hypoxia decreases mRNA and protein expression of SGLT1 and SGLT2, These results are similar to those obtained by Kles and Tappenden (37) in a model of rat jejunum epithelium hypoxia. Glucose transport was measured for 1 h in rat jejunum perfused with a solution containing mannitol, glucose, or glutamine. Under these conditions, glucose uptake was reduced, whereas glutamine transport remained unchanged. Brush border membranes obtained from these preparations showed a significant decrease in SGLT1 mRNA under hypoxic conditions, but protein expression was not modified. These data indicate that the activity and mRNA expression level of SGLT1 are regulated by hypoxia, without changes in protein expression.
Evidence has shown a clear increase in renal GLUT1 during hypoxia mediated by HIF-1. In human tubular epithelial cells, GLUT1 mRNA has been found to be increased under 1% O2 hypoxia (38). However, renal HIF-1 increases the expression of the GLUT1 gene, currently used as a control to test the effects of HIF-1α. Our results clearly confirm an increase in mRNA and protein expression of GLUT1, which correlates with the changes in HIF-1α mRNA and protein. To explore further whether the effects were caused by this protein, we tested the response to hypoxia in the presence of albendazole, a compound reportedly known for its ability to inhibit the effect of HIF-1α and VEGF in human ovarian cancer cells (27). Consequently, a decrease in HIF-1α and GLUT1 expression under hypoxia was confirmed with 1 μm albendazole in our model.
No changes in viability were observed under 0% O2 hypoxia at all incubation times. However, 300 μm CoCl2, the usual concentration used to induce HIF-1α expression, caused a reduction in cell viability to 50% at 12 h; these changes were noted with 1-, 3-, and 6-h incubations. Because CoCl2 has been widely used as a model to induce chemical hypoxia, results obtained with this compound must be analyzed with care, as other dose-related mechanisms are linked to CoCl2 (39).
Cobalt salts can induce chemical hypoxia by two mechanisms of action. The first and best known of them is the inhibition of prolyl hydroxylases by binding to a HIF-1α oxygen-dependent degradation domain (40); the second mechanism involves the inhibition of von Hippel-Lindau protein binding to HIF-1α (31). The latter may account for the actions of cobalt in chemical hypoxia at low doses; however, there are scarce published reports describing this chemical interaction. In this sense, cobalt salts mitigate the development of diabetic nephropathy, where they decrease proteinuria and tubulointerstitial fibrosis in a type 2 diabetes model in rats (16). Matsumoto et al. showed that cobalt administration in a single dose activates protector genes in the kidneys before exposure to ischemia by activating HIF-1 and up-regulating HO-1, EPO, GLUT1, and VEGF mRNA expression (19).
In addition, cobalt at high doses has genotoxic and carcinogenic effects in in vivo and in vitro models, due to resulting DNA damage and interference with DNA repair mechanisms (39, 41). This accounts for the higher cell viability with 0–5% O2 hypoxia in a sealed modular hypoxic chamber compared with the use of CoCl2.
Renal blood flow rate represents one fifth of the cardiac output, and compared with other organs, O2 consumption is high under basal conditions (42). When Na+ reabsorption mechanisms are activated under experimental observations, an increased O2 consumption is normally observed in the kidney (43). However, intravenous perfusion of amino acids in healthy men has not shown to change the O2 basal levels in the kidney (44). Thus, the kidney maintains a relatively low and constant O2 uptake in both basal and stimulated conditions, with exception to the sodium reabsorption rate. However, a 1:7 ratio is maintained in O2 consumption when comparing renal inner medulla to renal cortex. As this low pO2 is characteristic of renal proximal tubule epithelium (45), hypoxia mechanisms are activated only when very low O2 concentrations are achieved. In this sense, minimal reductions in pO2 may occur under diabetic nephropathy and glomerulosclerosis, inducing the activation of intracellular signaling that leads to the up-regulation of HIF-1α, especially in the proximal tubule, and of those transporters involved in the glycolytic pathways. Our results support the hypothesis that renal transporters may be modified under hypoxia; however, it must be noted that glucose transport has not been evaluated. As such, we cannot rule out changes in sugar transport kinetics (Vmax and Km). Nevertheless, there is evidence that tubular necrosis in acute and chronic renal failure may decrease or limit O2 diffusion into the renal proximal tubule epithelia, inducing critical metabolic changes in the proximal epithelium as a homeostatic recovery response (46).
In conclusion, we have demonstrated HIF-1α mediated changes in mRNA and protein expression of the renal transporters SGLT1 and SGLT2 in LLC-PK1 cell monolayers under low O2 concentrations similar to those prevailing in the renal cortex. These results may explain renal epithelium cellular adaptation mechanisms to maintain intracellular glucose homeostasis in vitro. In addition, we propose that future research regarding the use of CoCl2 should be analyzed carefully because of its deleterious effects on cell viability.
This work was supported by Programa para el Mejoramiento del Profesorado (PROMEP) Grant PROMEP/103.5/09/599 (to O. G. G.-C.) and Programa Integral de Fortalecimiento Institucional (PIFI) Grant 2009-24MSU0011E-12 (to F. M. M.).
- HIF-1α
- hypoxia-inducible factor 1α
- ABZ
- albendazole
- GLUT
- glucose transporter
- MTS
- 3-(4,5-dimethylthiazol-2-yl)-5-(3-carboxymethoxyphenyl)-2-(4-sulfophenyl)-2H-tetrazolium
- SGLT
- sodium glucose transport.
REFERENCES
- 1. Semenza G. L. (2008) Hypoxia-inducible factor 1 and cancer pathogenesis. IUBMB Life 60, 591–597 [DOI] [PubMed] [Google Scholar]
- 2. Berra E., Roux D., Richard D. E., Pouysségur J. (2001) Hypoxia-inducible factor-1α (HIF-1α) escapes O2-driven proteasomal degradation irrespective of its subcellular localization: nucleus or cytoplasm. EMBO Rep. 2, 615–620 [DOI] [PMC free article] [PubMed] [Google Scholar]
- 3. Jaakkola P., Mole D. R., Tian Y. M., Wilson M. I., Gielbert J., Gaskell S. J., von Kriegsheim A., Hebestreit H. F., Mukherji M., Schofield C. J., Maxwell P. H., Pugh C. W., Ratcliffe P. J. (2001) Targeting of HIF-1α to the von Hippel-Lindau ubiquitylation complex by O2-regulated prolyl hydroxylation. Science 292, 468–472 [DOI] [PubMed] [Google Scholar]
- 4. Semenza G. L. (2001) HIF-1 and mechanisms of hypoxia sensing. Curr. Opin. Cell Biol. 13, 167–171 [DOI] [PubMed] [Google Scholar]
- 5. Yamashita K., Discher D. J., Hu J., Bishopric N. H., Webster K. A. (2001) Molecular regulation of the endothelin-1 gene by hypoxia: contributions of hypoxia-inducible factor-1, activator protein-1, GATA-2, and p300/CBP. J. Biol. Chem. 276, 12645–12653 [DOI] [PubMed] [Google Scholar]
- 6. Graven K. K., Yu Q., Pan D., Roncarati J. S., Farber H. W. (1999) Identification of an oxygen responsive enhancer element in the glyceraldehyde-3-phosphate dehydrogenase gene. Biochim. Biophys. Acta 1447, 208–218 [DOI] [PubMed] [Google Scholar]
- 7. Chaudary N., Naydenova Z., Shuralyova I., Coe I. R. (2004) Hypoxia regulates the adenosine transporter, mENT1, in the murine cardiomyocyte cell line, HL-1. Cardiovasc. Res. 61, 780–788 [DOI] [PubMed] [Google Scholar]
- 8. Wiesener M. S., Münchenhagen P. M., Berger I., Morgan N. V., Roigas J., Schwiertz A., Jürgensen J. S., Gruber G., Maxwell P. H., Löning S. A., Frei U., Maher E. R., Gröne H. J., Eckardt K. U. (2001) Constitutive activation of hypoxia-inducible genes related to overexpression of hypoxia-inducible factor 1α in clear cell renal carcinomas. Cancer Res. 61, 5215–5222 [PubMed] [Google Scholar]
- 9. Rosenberger C., Khamaisi M., Abassi Z., Shilo V., Weksler-Zangen S., Goldfarb M., Shina A., Zibertrest F., Eckardt K. U., Rosen S., Heyman S. N. (2008) Adaptation to hypoxia in the diabetic rat kidney. Kidney Int. 73, 34–42 [DOI] [PubMed] [Google Scholar]
- 10. Semenza G. L. (2002) Involvement of hypoxia-inducible factor 1 in human cancer. Intern. Med. 41, 79–83 [DOI] [PubMed] [Google Scholar]
- 11. Takiyama Y., Harumi T., Watanabe J., Fujita Y., Honjo J., Shimizu N., Makino Y., Haneda M. (2011) Tubular injury in a rat model of type 2 diabetes is prevented by metformin: a possible role of HIF-1α expression and oxygen metabolism. Diabetes 60, 981–992 [DOI] [PMC free article] [PubMed] [Google Scholar]
- 12. Lang F., Capasso G., Schwab M., Waldegger S. (2005) Renal tubular transport and the genetic basis of hypertensive disease. Clin. Exp. Nephrol. 9, 91–99 [DOI] [PubMed] [Google Scholar]
- 13. Nagy G., Kovacs-Nagy R., Kereszturi E., Somogyi A., Szekely A., Nemeth N., Hosszufalusi N., Panczel P., Ronai Z., Sasvari-Szekely M. (2009) Association of hypoxia inducible factor-1α gene polymorphism with both type 1 and type 2 diabetes in a Caucasian (Hungarian) sample. BMC Med. Genet. 10, 79. [DOI] [PMC free article] [PubMed] [Google Scholar]
- 14. Deng A., Arndt M. A., Satriano J., Singh P., Rieg T., Thomson S., Tang T., Blantz R. C. (2010) Renal protection in chronic kidney disease: hypoxia-inducible factor activation vs. angiotensin II blockade. Am. J. Physiol. Renal Physiol. 299, F1365–F1373 [DOI] [PMC free article] [PubMed] [Google Scholar]
- 15. Friederich M., Hansell P., Palm F. (2009) Diabetes, oxidative stress, nitric oxide and mitochondria function. Curr. Diabetes Rev. 5, 120–144 [DOI] [PubMed] [Google Scholar]
- 16. Ohtomo S., Nangaku M., Izuhara Y., Takizawa S., Strihou C. v., Miyata T. (2008) Cobalt ameliorates renal injury in an obese, hypertensive type 2 diabetes rat model. Nephrol. Dial. Transplant. 23, 1166–1172 [DOI] [PubMed] [Google Scholar]
- 17. You Y., Hirsch D. J., Morgunov N. S. (1992) Functional integrity of proximal tubule cells: effects of hypoxia and ischemia. J. Am. Soc. Nephrol. 3, 965–974 [DOI] [PubMed] [Google Scholar]
- 18. Nangaku M. (2006) Chronic hypoxia and tubulointerstitial injury: a final common pathway to end-stage renal failure. J. Am. Soc. Nephrol. 17, 17–25 [DOI] [PubMed] [Google Scholar]
- 19. Matsumoto M., Makino Y., Tanaka T., Tanaka H., Ishizaka N., Noiri E., Fujita T., Nangaku M. (2003) Induction of renoprotective gene expression by cobalt ameliorates ischemic injury of the kidney in rats. J. Am. Soc. Nephrol. 14, 1825–1832 [DOI] [PubMed] [Google Scholar]
- 20. Song Y. R., You S. J., Lee Y. M., Chin H. J., Chae D. W., Oh Y. K., Joo K. W., Han J. S., Na K. Y. (2010) Activation of hypoxia-inducible factor attenuates renal injury in rat remnant kidney. Nephrol. Dial. Transplant. 25, 77–85 [DOI] [PubMed] [Google Scholar]
- 21. Haase V. H. (2006) Hypoxia-inducible factors in the kidney. Am. J. Physiol. Renal Physiol. 291, F271–F281 [DOI] [PMC free article] [PubMed] [Google Scholar]
- 22. El Awad B., Kreft B., Wolber E. M., Hellwig-Bürgel T., Metzen E., Fandrey J., Jelkmann W. (2000) Hypoxia and interleukin-1β stimulate vascular endothelial growth factor production in human proximal tubular cells. Kidney Int. 58, 43–50 [DOI] [PubMed] [Google Scholar]
- 23. Maldonado-Cervantes M. I., Galicia O. G., Moreno-Jaime B., Zapata-Morales J. R., Montoya-Contreras A., Bautista-Perez R., Martinez-Morales F. (2012) Autocrine modulation of glucose transporter SGLT2 by IL-6 and TNF-α in LLC-PK1 cells. J. Physiol. Biochem. 68, 411–420 [DOI] [PubMed] [Google Scholar]
- 24. Ohta T., Isselbacher K. J., Rhoads D. B. (1990) Regulation of glucose transporters in LLC-PK1 cells: effects of d-glucose and monosaccharides. Mol. Cell. Biol. 10, 6491–6499 [DOI] [PMC free article] [PubMed] [Google Scholar]
- 25. Phillips A. O., Steadman R., Morrisey K., Williams J. D. (1997) Polarity of stimulation and secretion of transforming growth factor-β1 by cultured proximal tubular cells. Am. J. Pathol. 150, 1101–1111 [PMC free article] [PubMed] [Google Scholar]
- 26. Sandau K. B., Zhou J., Kietzmann T., Brüne B. (2001) Regulation of the hypoxia-inducible factor 1α by the inflammatory mediators nitric oxide and tumor necrosis factor-α in contrast to desferroxamine and phenylarsine oxide. J. Biol. Chem. 276, 39805–39811 [DOI] [PubMed] [Google Scholar]
- 27. Pourgholami M. H., Cai Z. Y., Badar S., Wangoo K., Poruchynsky M. S., Morris D. L. (2010) Potent inhibition of tumoral hypoxia-inducible factor 1α by albendazole. BMC Cancer 10, 143. [DOI] [PMC free article] [PubMed] [Google Scholar]
- 28. Maxwell P. (2003) HIF-1: an oxygen response system with special relevance to the kidney. J. Am. Soc. Nephrol. 14, 2712–2722 [DOI] [PubMed] [Google Scholar]
- 29. Agrawal A., Guttapalli A., Narayan S., Albert T. J., Shapiro I. M., Risbud M. V. (2007) Normoxic stabilization of HIF-1α drives glycolytic metabolism and regulates aggrecan gene expression in nucleus pulposus cells of the rat intervertebral disk. Am. J. Physiol. Cell Physiol. 293, C621–C631 [DOI] [PubMed] [Google Scholar]
- 30. Cheng K., Ho K., Stokes R., Scott C., Lau S. M., Hawthorne W. J., O'Connell P. J., Loudovaris T., Kay T. W., Kulkarni R. N., Okada T., Wang X. L., Yim S. H., Shah Y., Grey S. T., Biankin A. V., Kench J. G., Laybutt D. R., Gonzalez F. J., Kahn C. R., Gunton J. E. (2010) Hypoxia-inducible factor-1α regulates β cell function in mouse and human islets. J. Clin. Invest. 120, 2171–2183 [DOI] [PMC free article] [PubMed] [Google Scholar]
- 31. Yuan Y., Hilliard G., Ferguson T., Millhorn D. E. (2003) Cobalt inhibits the interaction between hypoxia-inducible factor-α and von Hippel-Lindau protein by direct binding to hypoxia-inducible factor-α. J. Biol. Chem. 278, 15911–15916 [DOI] [PubMed] [Google Scholar]
- 32. Jones D. P., Kennedy F. G. (1982) Intracellular oxygen supply during hypoxia. Am. J. Physiol. 243, C247–C253 [DOI] [PubMed] [Google Scholar]
- 33. Takano T., Soltoff S. P., Murdaugh S., Mandel L. J. (1985) Intracellular respiratory dysfunction and cell injury in short-term anoxia of rabbit renal proximal tubules. J. Clin. Invest. 76, 2377–2384 [DOI] [PMC free article] [PubMed] [Google Scholar]
- 34. Jiang B. H., Semenza G. L., Bauer C., Marti H. H. (1996) Hypoxia-inducible factor 1 levels vary exponentially over a physiologically relevant range of O2 tension. Am. J. Physiol. 271, C1172–C1180 [DOI] [PubMed] [Google Scholar]
- 35. Wenger R. H., Stiehl D. P., Camenisch G. (2005) Integration of oxygen signaling at the consensus HRE. Sci. STKE 2005, re12. [DOI] [PubMed] [Google Scholar]
- 36. Lukiw W. J., Ottlecz A., Lambrou G., Grueninger M., Finley J., Thompson H. W., Bazan N. G. (2003) Coordinate activation of HIF-1 and NF-κB DNA binding and COX-2 and VEGF expression in retinal cells by hypoxia. Invest. Ophthalmol. Vis. Sci. 44, 4163–4170 [DOI] [PubMed] [Google Scholar]
- 37. Kles K. A., Tappenden K. A. (2002) Hypoxia differentially regulates nutrient transport in rat jejunum regardless of luminal nutrient present. Am. J. Physiol. Gastrointest. Liver Physiol. 283, 1336–1342 [DOI] [PubMed] [Google Scholar]
- 38. Leonard M. O., Cottell D. C., Godson C., Brady H. R., Taylor C. T. (2003) The role of HIF-1α in transcriptional regulation of the proximal tubular epithelial cell response to hypoxia. J. Biol. Chem. 278, 40296–40304 [DOI] [PubMed] [Google Scholar]
- 39. De Boeck M., Kirsch-Volders M., Lison D. (2003) Cobalt and antimony: genotoxicity and carcinogenicity. Mutat. Res. 533, 135–152 [DOI] [PubMed] [Google Scholar]
- 40. Epstein A. C., Gleadle J. M., McNeill L. A., Hewitson K. S., O'Rourke J., Mole D. R., Mukherji M., Metzen E., Wilson M. I., Dhanda A., Tian Y. M., Masson N., Hamilton D. L., Jaakkola P., Barstead R., Hodgkin J., Maxwell P. H., Pugh C. W., Schofield C. J., Ratcliffe P. J. (2001) C. elegans EGL-9 and mammalian homologs define a family of dioxygenases that regulate HIF by prolyl hydroxylation. Cell 107, 43–54 [DOI] [PubMed] [Google Scholar]
- 41. Lison D., De Boeck M., Verougstraete V., Kirsch-Volders M. (2001) Update on the genotoxicity and carcinogenicity of cobalt compounds. Occup. Environ. Med. 58, 619–625 [DOI] [PMC free article] [PubMed] [Google Scholar]
- 42. Thakar C. V., Arrigain S., Worley S., Yared J. P., Paganini E. P. (2005) A clinical score to predict acute renal failure after cardiac surgery. J. Am. Soc. Nephrol. 16, 162–168 [DOI] [PubMed] [Google Scholar]
- 43. Deng A., Miracle C. M., Suarez J. M., Lortie M., Satriano J., Thomson S. C., Munger K. A., Blantz R. C. (2005) Oxygen consumption in the kidney: effects of nitric oxide synthase isoforms and angiotensin II. Kidney Int. 68, 723–730 [DOI] [PubMed] [Google Scholar]
- 44. Brundin T., Wahren J. (1994) Renal oxygen consumption, thermogenesis, and amino acid utilization during i.v. infusion of amino acids in man. Am. J. Physiol. 267, E648–E655 [DOI] [PubMed] [Google Scholar]
- 45. Aukland K., Krog J. (1960) Renal oxygen tension. Nature 188, 671. [DOI] [PubMed] [Google Scholar]
- 46. Evans R. G., Gardiner B. S., Smith D. W., O'Connor P. M. (2008) Intrarenal oxygenation: unique challenges and the biophysical basis of homeostasis. Am. J. Physiol. Renal Physiol. 295, F1259–F1270 [DOI] [PubMed] [Google Scholar]


