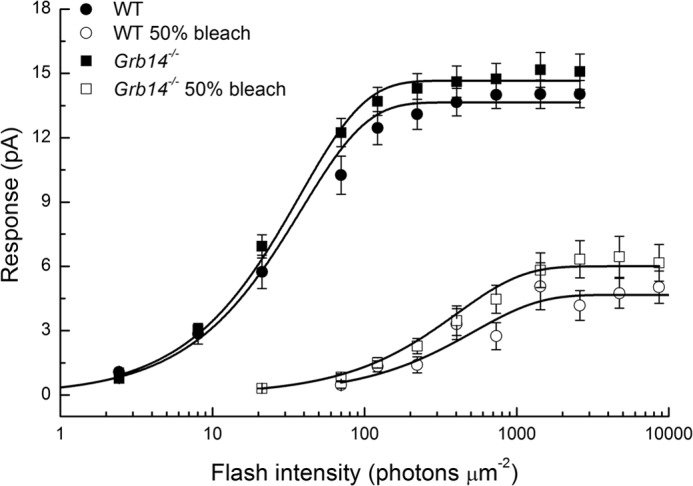
FIGURE 4.

Response as a function of flash intensity Grb14−/− and WT rods under dark-adapted and bleach-adapted conditions. Data are from the rods of Fig. 2. Error bars give standard errors of the mean. Means have been fitted with exponential saturation function, r = rmax (1 − exp(−kI)), where r is the amplitude of the response, rmax is the maximum value of the response, I is the flash intensity, and k is a constant. Best fitting values were as follows: WT dark-adapted, rmax = 13.7, k = 0.026; Grb14−/− dark-adapted, rmax = 14.7, k = 0.027; WT bleach-adapted, rmax = 4.7, k = 0.0019; and Grb14−/− bleach-adapted, rmax = 6.0, k = 0.0025.
