FIGURE 2.
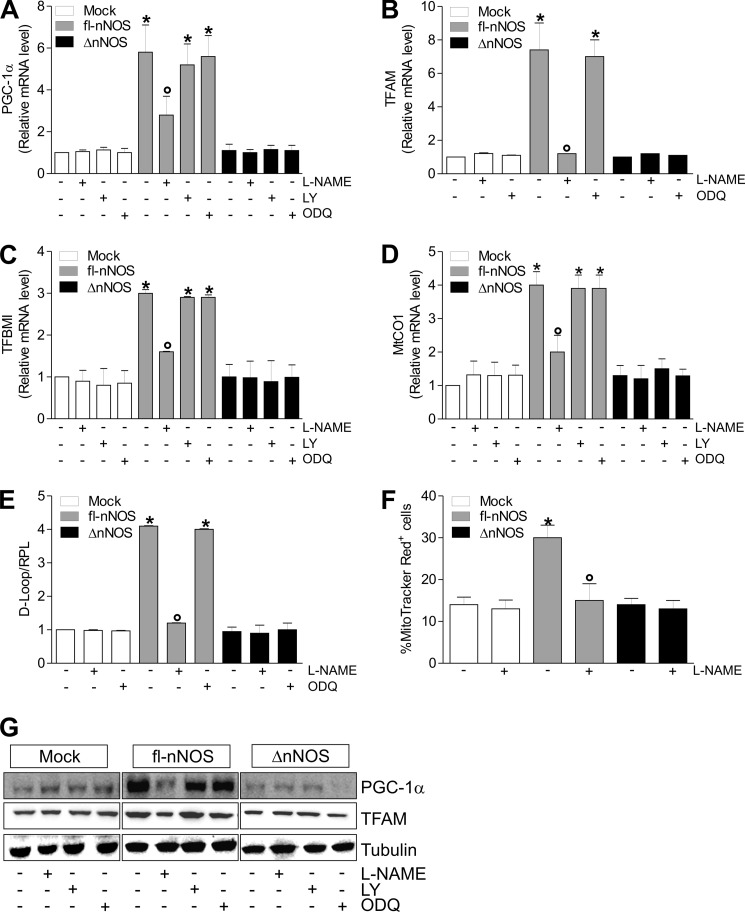
fl-nNOS overexpression elicits mitochondrial biogenesis in C2C12 cells. C2C12 cells were transiently transfected as reported in the legend to Fig. 1. After transfection, the cells were treated with l-NAME (100 μm), LY83583 (LY, 2 μm), or ODQ (10 μm) for 24 h. A–D, total RNA was isolated and relative mRNA levels of PGC-1α (A), TFAM (B), mitochondrial transcription factor B (TFBMI, C), and MtCO1 (D) were analyzed by RT-qPCR. The data are expressed as means ± S.D. (n = 7; *, p < 0.05 versus mock cells; °, p < 0.05 versus untreated fl-nNOS cells). E, DNA was extracted, and relative mitochondrial content was assayed by analyzing the D-loop noncoding mtDNA region through qPCR. The D-loop value was normalized to RPL. The data are expressed as means ± S.D. (n = 6; *, p < 0.001 versus mock; °, p < 0.01 versus untreated fl-nNOS). F, cells were incubated with MitoTracker Red for 30 min, and mitochondrial content was assayed by cytofluorimetric analysis. The data are expressed as percentages of MitoTracker Red-positive cells (n = 4; *, p < 0.05 versus mock cells; °, p < 0.05 versus untreated fl-nNOS cells). G, 20 μg of total protein extracts were loaded for detection of PGC-1α and TFAM by Western blot. Tubulin was used as loading control. Immunoblots reported are representative of at least four experiments that gave similar results.

