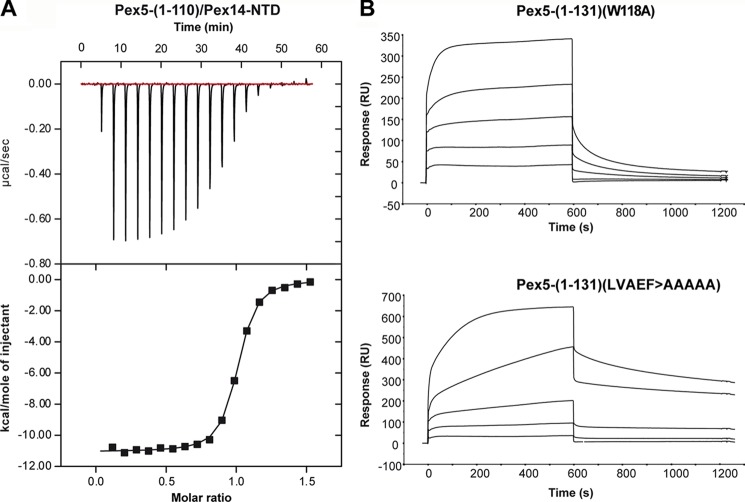
FIGURE 5.
Rate and equilibrium binding constants of the interaction of regions of Pex5 and Pex14. A, ITC curve of the interaction between Pex5-(1–110) and the N-terminal domain of Pex14 (Pex14-NTD). Pex14-NTD was injected into the cell, containing Pex5-(1–110), and the heat of binding was measured per mol of injectant. The raw data were fitted to a one-site binding model, which yielded a KD of 157 ± 9 nm with a stoichiometry of 0.97 ± 0.002. B, for surface plasmon resonance spectroscopy analyses, 700 response units (RU) of purified GST-Pex14-NTD were immobilized on an anti-GST sensor chip surface, and varying concentrations of purified Pex5-(1–131)(W118A) and Pex5-(1–131)(LVAEF > AAAAA) were applied. The concentrations used for both Pex5-(1–131) constructs were as follows: 1, 4, 15, 60, and 240 nm (graphs from bottom to top). Analyses were performed as described under “Experimental Procedures,” and the results are summarized in Table 3.

