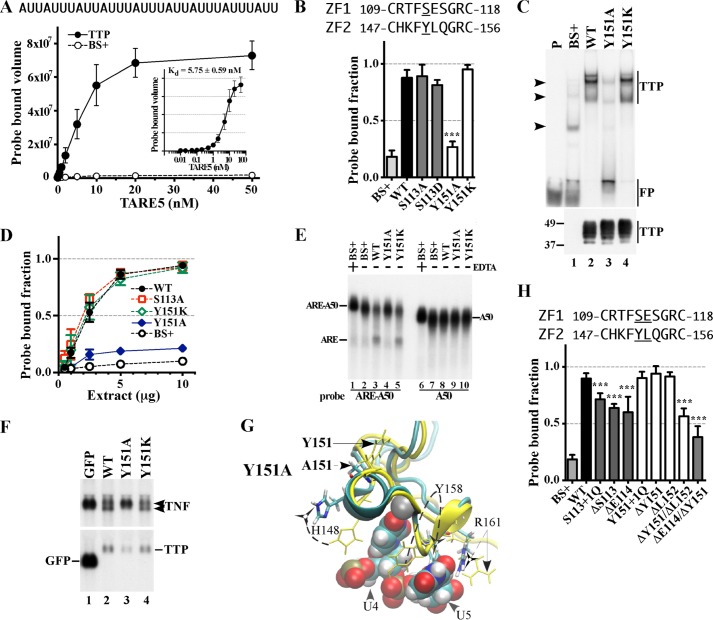
FIGURE 3.
Effect of mutated residues in the CX8C regions of the human TTP TZF domain on RNA binding and RNA stability. A, equilibrium binding of probe TARE5 (0.01–50 nm) to extracts of HEK293 cells transfected with TTP or vector (BS+) as described under “Experimental Procedures.” The sequence of the RNA probe is depicted above the graph. The inset shows the TTP probe binding curve, in which the x axis was transformed into antilog, and the apparent dissociation constant (Kd ± S.D.) was calculated from quantification of three independent experiments. B, the binding of protein to RNA is expressed as the probe-bound fraction. Above the graph are the amino acid sequences of the intervals. The underlined residues are those that were mutated and whose effects on binding are shown in the bar graph. The results from mutants of finger 1 are shown as gray columns, and those of finger 2 are shown as white columns. The results (mean ± S.D. (error bars)) are from three similar gel shift assays using 0.2 nm probe TARE5. C, the top panel shows representative gel shift assays using extracts from HEK293 cells transfected with vector alone (BS+), WT human TTP, or various mutant TTP constructs. Cytosolic extracts were incubated with 0.2 nm probe TARE5 as described under “Experimental Procedures” before loading on a non-denaturing acrylamide gel. A sample that contained probe alone in buffer was also loaded (lane P). The migration positions of the TTP-ARE complex (TTP) and the free probe (FP) are indicated to the right with vertical bars, and the three major endogenous protein-ARE complexes are labeled with arrowheads to the left. The bottom panel shows the relative amount of WT TTP protein and its mutants used in the binding reaction, as determined by Western blotting. D, binding assays with 0.2 nm TARE5 probe in serially diluted extract, where total protein ranges from 10 to 1 μg, were performed as described under “Experimental Procedures.” The probe-bound fractions (mean ± S.D.) are from three similar gel shift assays. E, shown is a deadenylation assay using these extracts (5 μg of protein/sample). In lanes 1 and 6, 20 mm EDTA was present during the incubation to inhibit the deadenylase activity. In lanes 1–5, the ARE-A50 probe was used. The full-length probe ARE-A50 and its deadenylated product ARE are indicated to the left. Probe A50 was used in the samples shown in lanes 6–10, and the migration of the probe is indicated to the right. F, Northern blots of a HEK293 cell co-transfection of CMV.TNF with control plasmid GFP (lane 1), WT TTP (lane 2), Y151A (lane 3), or Y151K (lane 4). Total cellular RNA was prepared from the cells, and 10 μg of RNA was used for each lane. The blots were hybridized with a TNF cDNA probe (top) or a mouse TTP cDNA probe and a GFP cDNA probe together (bottom). The migration positions of the TNF mRNA and the TTP mRNA are indicated to the right, and that of the GFP RNA is shown to the left. G, superposition of WT TTP finger 2 and its mutant Y151A structure ensembles. The wild-type TTP peptide backbone ribbon and side chains are in yellow, and the mutant Y151A peptide backbone ribbon is in cyan, with side chains in colors. Zinc atoms (superimposed) are shown as silver spheres. Also shown are ARE nucleosides U4 and U5 (RMSD value calculated from superposition of the TZF domains of Y151A with RNA-bound WT TTP is 8.98 Å). H, the binding of protein to RNA is expressed as the probe-bound fraction. The results (mean ± S.D.) are from three similar gel shift assays. The results from mutants of finger 1 are shown as gray columns, and those of finger 2 are shown as white columns. Other details are similar to those described in B.

