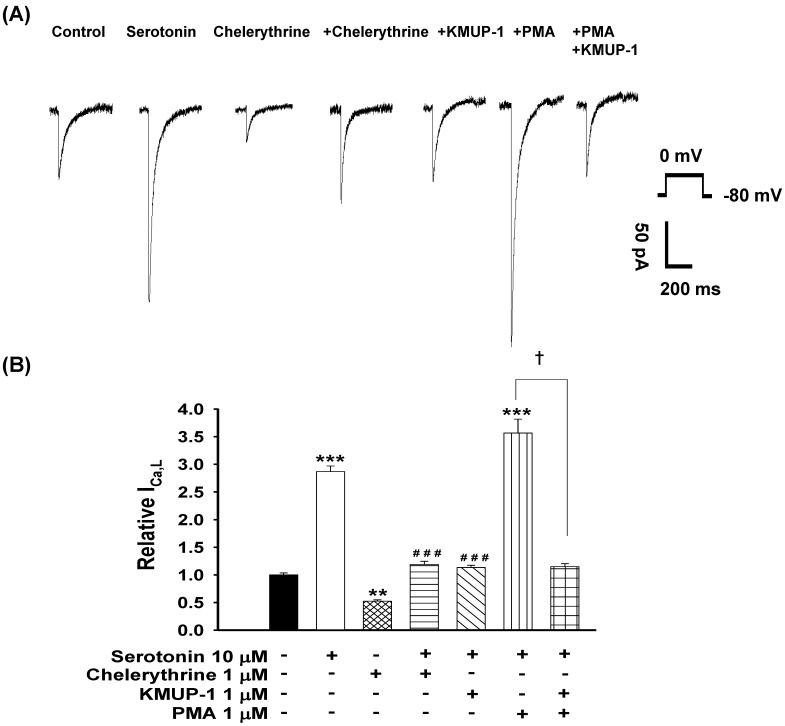
Figure 5.
Effects of KMUP-1 on serotonin-increased ICa,L via the PKC pathway in hypertrophic H9c2 cells. (A) Representative recordings of ICa,L evoked by test pulse to 0 mV from a holding potential of -80 mV in H9c2 cells. Cells were treated with 10 μM serotonin, 1 μM chelerythrine, 10 μM serotonin+1 μM chelerythrine, 10 μM serotonin+1 μM KMUP-1, 10 μM serotonin+1 μM PMA or 10 μM serotonin+1 μM PMA+1 μM KMUP-1 for 4 days. (B) Bar graph showing the relative ICa,L averaged from the recordings of trace (A). Data are means ± SE, n=8. ** P<0.01, *** P <0.001 compared with control. ###P<0.001 compared with the serotonin group. ✝P <0.001 compared with the serotonin+PMA group.

