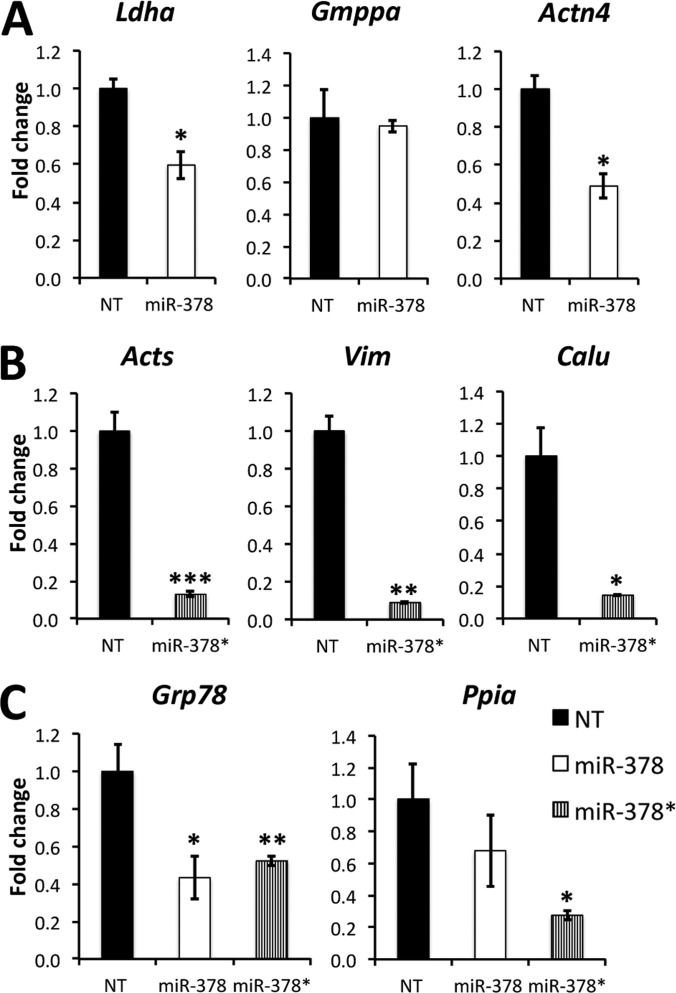
Fig. 2.
Analysis of mRNA expression by Q RT-PCR. A, miR-378 targets. B, miR-378* targets. C, Targets of both miRs. Whole RNA was extracted from H9c2 cells transfected with miR-378 or miR-378*. We performed mRNA reverse transcription followed by semi-quantitative real time PCR using hprt as a reference gene. Ratios are expressed as fold change over nontransfected (NT) cells. Data are expressed as mean ± S.E. *p ≤ 0.05, **p ≤ 0.01, ***p ≤ 0.001 miR versus control. n = 3 for each group.

