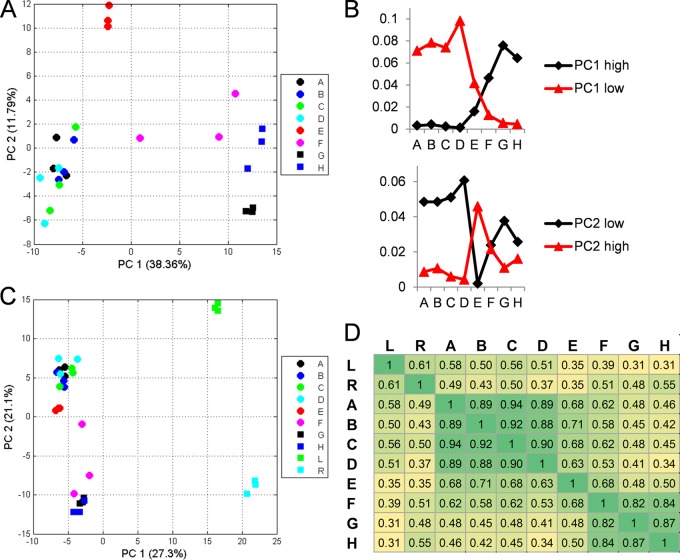
Fig. 4.
Multivariant statistic analysis. A, PCA plot of the eight stages of pollen development. B, sum of the NSAF scores of the 30 highest and 30 most negative loadings of PC1 and PC2, respectively. C, PCA plot of the eight stages of pollen development including leaves and roots. PCA was based on log values of the NSAF scores. D, correlation coefficient according to calculated average NSAF values of three replicates. A, microsporocytes; B, meiotic cells; C, tetrads; D, microspores; E, polarized microspores; F, binuclear pollen; G, desiccated pollen; H, pollen tubes; L, leaves; R, roots.

