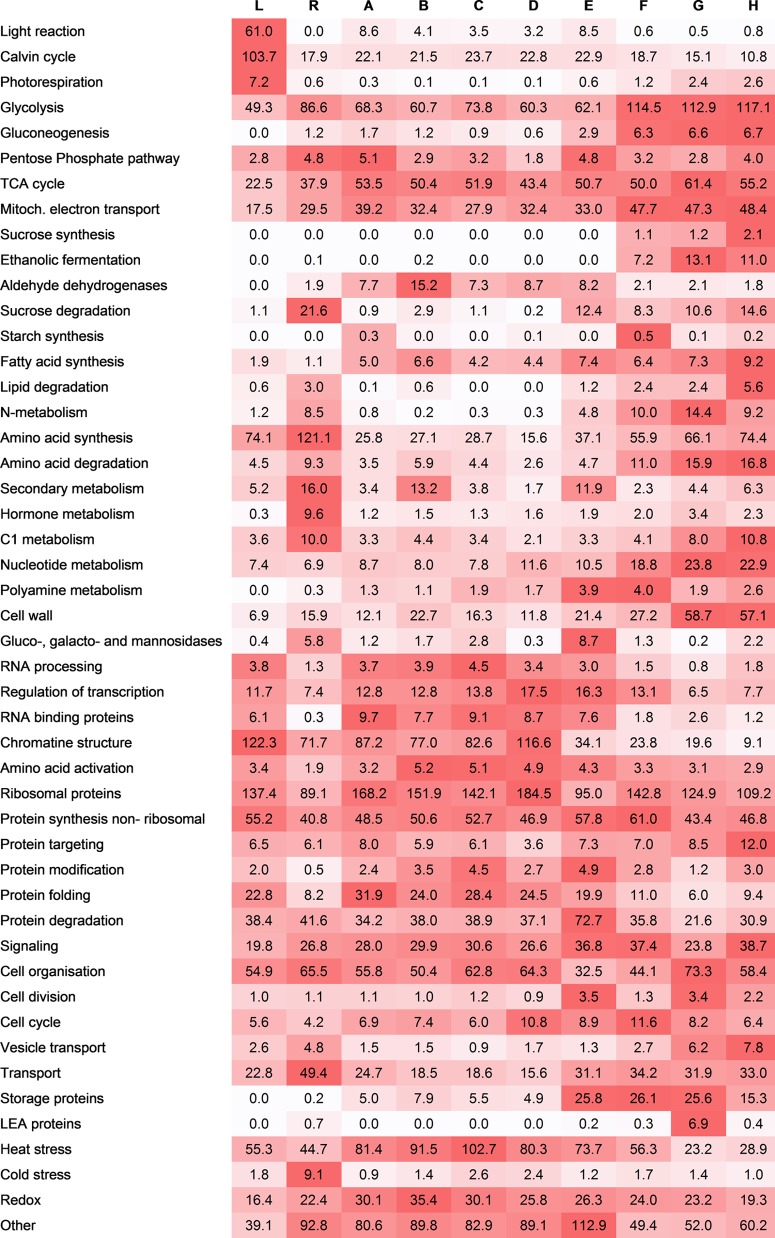
Fig. 6.
Functional analysis. Total NSAF scores of proteins grouped in functional groups. NSAF scores were averaged over three biological replicates and multiplied by 1000. Red indicates high abundance in relation to the other stages. Standard deviation can be assessed from supplemental Table S7. L, leaves; R, roots; A, microsporocytes; B, meiotic cells; C, tetrads; D, microspores; E, polarized microspores; F, binuclear pollen; G, desiccated pollen; H, pollen tubes.

