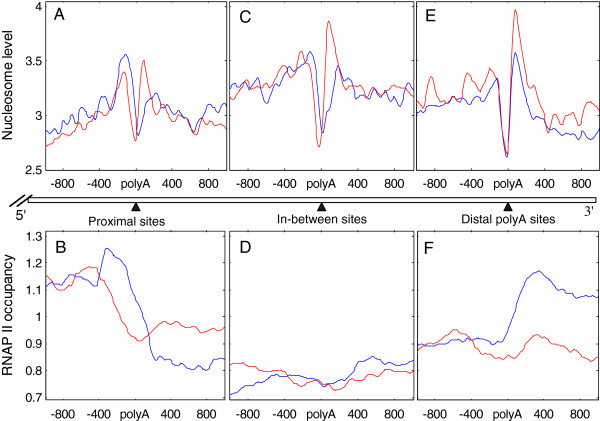
Figure 4.
Relationship among nucleosome, RNAP II occupancy and the usage of proximal, in-between and distal polyA sites. (A-B) Nucleosome distribution and RNAP II occupancy near high-usage and low-usage proximal polyA sites of expressed genes in CD4+ T cell (RPKM > 1). (C-D) Nucleosome distribution and RNAP II occupancy near high-usage and low-usage in-between polyA sites of expressed genes in CD4+ T cell (RPKM > 1). (E-F) Nucleosome distribution and RNAP II occupancy near high-usage and low-usage distal polyA sites of expressed genes in CD4+ T cell (RPKM > 1). The blue curve represents high-usage sites that have the lowest RUD in the gene, and the red curve represents low-usage sites that have the highest RUD in the gene.

