Figure 4.
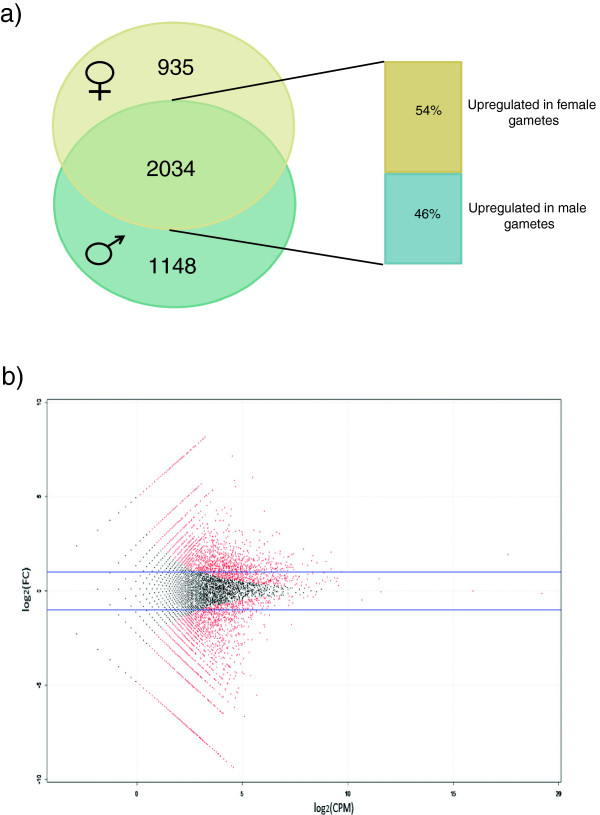
Differential gene expression between male and female gametes of Ectocarpus. a) Venn diagram showing the distribution of 4117 differentially expressed genes between gametes (Fold Change > = 2; FDR < 5%), with 935 and 1148 genes being found expressed only in female and male gametes respectively. Out of the 2034 genes expressed in both gamete types, 54% are upregulated in females. b) Scatter plot showing distribution of fold-change in expression in male versus female gametes (y-axis) against expression level (x-axis). Differentially expressed genes at significance level of FDR < 5% are colored red; blue line indicates 2-fold difference in expression.

