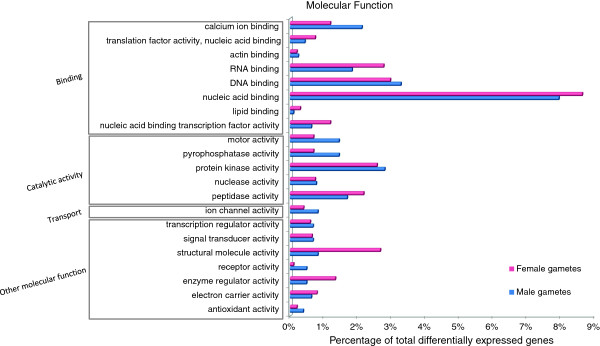
Figure 6.

- Functional classification of differentially expressed genes according to molecular function GO slim categories. Genes were considered differentially regulated if the fold change was > =2 and FDR value was <5%. Values are expressed as percentage of genes in each differentially expressed group.
