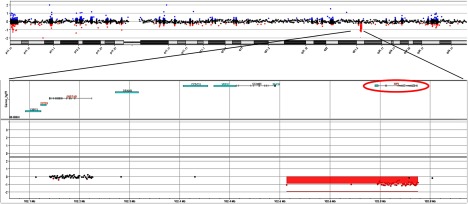
Figure 2.

CNV analysis of proband reveals heterozygous deletion of IGF-1. Top, Schematic of chromosome 12 segment. Each dot represents a single copy number probe. Dot color indicates areas of deletion (red) and duplication (blue). Bottom, Magnified schematic segment containing the deletion of interest (red box). The location of the IGF-1 gene (circled above) is noted to be included in this region.
