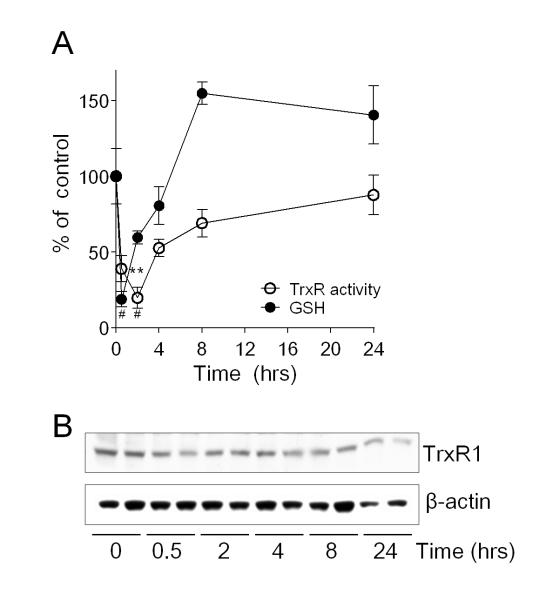
Figure 1.
Reversible GSH depletion and inactivation of TrxR after acute acrolein exposure. HBE1 cells were exposed to 30 μM acrolein for 30 min, and subsequently incubated for up to 24 hrs. (A) Cellular GSH levels (closed symbols) and TrxR activity (open symbols) were analyzed at indicated times after acrolein treatment, using HPLC and insulin assay, respectively. Data points represent mean ± SEM (n=4). **: p < 0.01, #: p < 0.001. Significance was designated after analysis by one-way ANOVA. (B) Western blot analysis of TrxR1 protein and β-actin at various time points after acrolein treatment (30 μM). A representative blot of 3 separate experiments is shown.

